CFHT, Instruments,
Detectors,
IR, Redeye Manual: Chapter 6.


With such a diverse assortment of users, the CFHT instrument control system
had to be designed so that it
could be quickly and easily mastered by visiting astronomers, yet provide the
power and flexibility that the
engineering staff demands. We believe the challenge of providing such an
interface has been met through
the development of the "Pegasus" operating environment. Visiting astronomers
can intuitively navigate
with relative ease through the system because the basic tools they need are
provided with simple menus.
Pointing with a mouse and selecting an option is much less demanding,
especially at 14,000 feet, than
trying to accomplish the same task from memory with a command line interface.
Redeye, like all of the
CFHT facility instruments, is operated through a Pegasus session, hence
observers who are already
familiar with running any of the facility instruments can quickly
learn how to use Redeye. In fact,
observers who are already familiar with FOCAM should find running Redeye to
be a very similar task.
Figure 6.1 shows the general layout of a session. Across the top of the screen is the command menu bar. It
includes a row of control buttons, a pull-down help menu, a pull-down session configuration menu, and a
text window displaying one-line help messages. Each button in the menu bar initiates a set of instrument
actions. These actions are grouped in specific "forms" in which user input is solicited. Put simply, the
menu bar contains all of the necessary controls for observing sessions. Note that large complex forms take
a longer time to open up, so be patient after clicking a menu button.
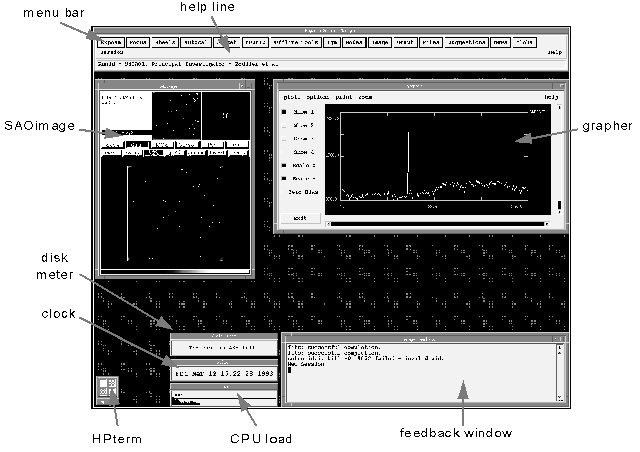
Figure 6.1 - The Redeye session layout is shown. Along the top of the
screen is a menu bar through which all camera functions can be controlled.
Down in the lower-right portion of the session window shown in Figure 6.1 is a system feedback window.
Note that the instrument name is part of the title area. The feedback window displays information
pertinent to the form being implemented. The start-up of a form usually outputs a line or two of text to the
feedback window. User and instrument errors are listed there as well. The lines in this window can be
scrolled to allow previously displayed output to be examined. It is in general wise to consult the feedback
window often to monitor the progress of the session and requested operations.
To the left of the feedback window in Figure 6.1 are three small windows displaying computer
information for the user's convenience. The top window shows the percentage of disk space remaining. If
the background color of this meter turns orange then the disk is nearing its storage capacity and the user
should save some files to tape and delete them from the disk. Below that is a clock displaying the
computer's system time. Below the clock is a CPU meter which display's the computer's processing load.
The CPU meter can be helpful to diagnose a system malfunction. For example, if a process creates
conflicts somewhere in the system, the CPU load will increase to non standard levels (a steep upward
trend).
This window is usually iconified (reduced to a small picture) in the lower left corner of the screen (see
Figure 6.1). This is a simple HPterm window from which UNIX commands can be entered. It is generally
of no use to the user/observer.
A large fraction of the session window is devoid of any windows and is referred to as the root window.
This is where forms will appear after clicking the desired menu bar button. It is possible to open several
forms at the same time but keep in mind that the computer load increases proportionally as more forms
are run in parallel.
Pointing (or moving on the screen) the mouse cursor at an object signals the computer of a possible
interest in that object. Clicking the left mouse button selects the pointed object (like turning on or off an
option) or performs the indicated action. Dragging the mouse cursor around the screen, while holding
down the left button, is used to move objects around, change window sizes, or browse through a
menu.
The background window that covers the whole display screen and currently filled with "CFH" labels is
called the root window. When the cursor is in this window it is shaped like a miniature dome. However,
when the cursor is moved to a session window, it changes to an arrowhead (window frame) or an "I"
(interior of the window). A window is considered "active" when the cursor is pointed at it. If no window is
active, any keyboard input is lost. The most visible indication that a window is active is that the window
frame changes color.
Displaying a menu is as easy as positioning the cursor over a menu button and then pressing (but don't let
go) the left mouse button. Now, drag the cursor down the menu. As the cursor moves each available
selection will highlight. When the desired selection is highlighted, release the mouse button to invoke that
selection.
Most forms contain four selection buttons, namely "Accept", "Save values", "Defaults", and "Cancel".
"Accept" changes all parameters, stores them, initiates any required actions, and closes the form. "Save
values" changes all parameters, stores them for later use, and closes the form. "Defaults" resets the
parameters to the system defaults which may or may not be useful. "Cancel" ignores all activity and closes
the form.
The form may also contain other items such as small boxes that contain alpha/numeric quantities such as
object name, exposure time, etc. To select these object fields for input one may either use < TAB> to
go from one field to the next or move the cursor to the field and click the left mouse button. In either case,
the desired field is highlighted upon selection, meaning keyboard input will be accepted.
Other buttons that may appear are toggle switches (on/off).Sometimes these buttons are mutually
exclusive (like buttons on a car radio). For example, in the EXPOSE form, bias, dark, object, and flat are
mutually exclusive since only one type of exposure may be taken. Such one-selection "radio buttons" are
always shaped like diamonds. Square shaped buttons correspond to a selection of an option among several
possibilities. A button is "on" when it appears as a filled diamond or box. Open diamonds or boxes are
considered "off".
A status icon provides information about a running process. Examples of status icons include:
- Instrument status icon: displays instrument device status after a motion order has been given.
- Array status icon (see Figure 6.2): provides information about a running Redeye exposure.
- Files status icon: provides information about files on disk or being saved to tape.
- IQE status icon: provides information about the image quality.
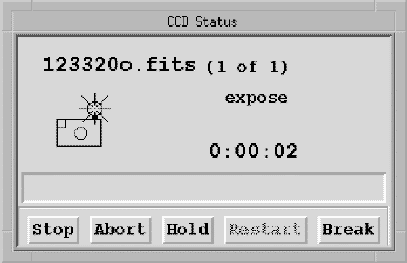
Figure 6.2 - An example of a status icon is shown. In this case the
status of an exposure in progress is shown.
Currently no "help" is available on-line (read this manual!). We are planning to implement on-line help in
the near future though.
To move a window first position the cursor in the title bar of the desired window. The title bar is the
rectangular area across the top of the window with text in it. When properly positioned, the cursor is an
arrowhead. With the left mouse button depressed, drag the window to the desired location on the
screen.
The size of a window can be changed by grabbing the window's frame with the cursor, dragging the frame
to the desired size with the left mouse button, and then releasing the mouse button. The cursor is
positioned correctly for resizing a window when it has an arrowhead shape, indicating the direction in
which the window will either grow or shrink. Note that some windows do not have a frame and therefore
cannot be resized. To bring a partially concealed window to the front of the overlying windows without
selecting from a menu, click anywhere on the window's frame with the left mouse button.
Read this section with a grain of salt. While users are not encouraged to iconify windows, unless they are
sure of the consequences, the more advanced users can definitely take advantage of this feature. Programs
running in an iconified window continue to execute until they finish or halt because they require input
from the user. A side-effect here is that it is possible to obstruct the observing process by having a crucial
window iconified and awaiting input. To iconify a window, first locate the minimize button. This is the
small square immediately to the right of the title bar on the window frame. Press the minimize button by
clicking on it with the left mouse button. Poof - the window has been changed to an icon sitting on the
lower left side of the root window. To move the icon elsewhere, position the cursor on the icon, press and
hold the left mouse button, drag the icon to a new location, and release the left mouse button. Normalizing
(change back to regular sized window) is done by simply positioning the cursor on the icon and double-
clicking the left mouse button. Note that some windows do not have a minimize button. This is either
because Pegasus does not allow such windows to be iconified, or it is not feasible to iconify them.
The following tools are found in the main menu bar in Redeye observing sessions:
- EXPOSE
: form used to initiate exposures.
- FILTERS
: form used to control Redeye filter wheels
- CAF
: form used to operate the computer aided focus
- MODES
: form used to set up automatic display and TCS enabling
- IMAGE
: form used to display images with the SAOimage/CFHTimage tool.
- GRAPH
: form used to display image cuts.
- IQE
: form used to compute image quality.
- FILES
: form used to manage image files on disk and tape.
- SUGGESTIONS
: form used to send suggestions for improvements or fixes to the system
manager.
- NEWS
: delivers the latest news on the Data Acquisition User Interface and the instrument.
- ALOHA
: form used to exit the observing session.
These main menu options are described in detail in the remainder of this chapter.
A Redeye exposure is initiated by clicking the EXPOSE button in the menu bar and filling out the form.
The user can enter the following in the EXPOSE form:
- Exposure type: object/bias/flat/dark
- Exposure time in seconds
- Number of iterations
- Median processing: on/off
- Object name: will be written to the FITS header
- Observer: will be written to the FITS header
- Comment: will be written to the FITS header
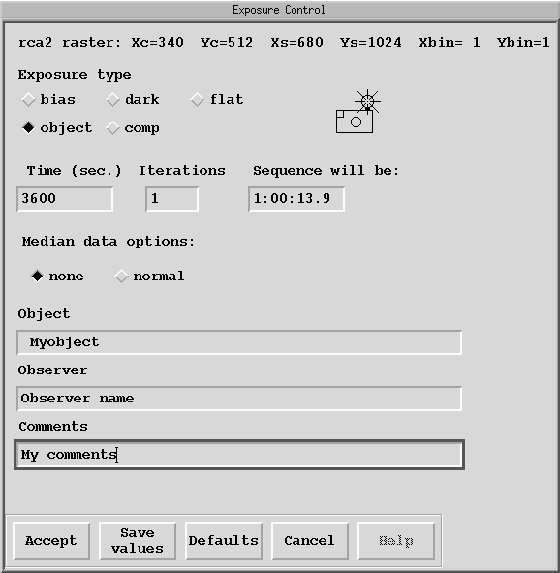
Figure 6.3 - The EXPOSE control form is shown.
Note that the observer and object fields are "sticky", i.e., remain the same through repeated
exposures until edited again. The exposure type defaults to "object" when opening the form. The median
data option provides an on-line capability for a fast and accurate combine algorithm for image sequences
(iterations > 1). When the "normal" median data option is selected a background process starts (the
process is currently handled by the summit Sparc station Wiki). After each image is recorded a copy is
sent to Wiki in the IRAF file format. After completion of the entire imaging sequence a "combine" task is
invoked. It is based on the well tested and widely used CCDRED/COMBINE task in the NOAO/IRAF
data processing environment. After extensive testing, it was decided to use the "average sigma clip" option
offered by this task since it leads to a final image with a mean identical to a "median" option, but with a
standard deviation improved by 10-15%. The average sigma clip algorithm works the following way.
First, a mean and a standard deviation value are computed for each set of images. After rejecting the min
and max values, then pixels with values exceeding x times (x~3) the standard deviation are rejected, and a
final mean value is computed. The current implementation of this option is extremely reliable and has
been extensively tested. It is mainly intended to help with fast reduction of flats and darks.
Once the fields have been edited/selected, take the appropriate action with one of the 4 "control"
buttons. A "Redeye status" icon will then appear (Figure 6.2) displaying the file name that has been
automatically linked to the image being acquired. This name has the form of a number, representing the
exposure number in the CFHT archive system, followed by a small letter: "o" for object, "f" for flat, "d" for
dark, or "b" for bias. The extension ".fits" is added to indicate that the data on disk is stored in FITS
format. The file name is a crucial parameter for locating data, either on the summit disks while observing,
or on the CFHT archive system. The status icon also shows the sequence number of the exposure (if you
are running a sequence), the status of the array controller ("expose" when the array is integrating,
"readout" when the data is being read out) and a count-down timer indicating the remaining exposure
time. Also, a set of 5 buttons appear on the bottom of the icon. They offer the following actions:
- Stop
: will stop the exposure, read-out the array, and create a
file with the appropriate
name. You can do this at any time during an integration. This will of course
shorten the exposure time,
depending on the time remaining on the timer.
- Abort
: will abort the exposure with no array read-out hence
discard the data.
- Hold
: will stop the exposure, but will not read out the array. You
can later use "restart" to
resume the exposure. Although the total integration time is not modified, the
array dark current will keep
accumulating while the exposure is on hold. The total dark time is therefore
the exposure time plus the
hold time. The field "DARKTIME" in the FITS header of the array file will
indicate the exact hold time.
Note that if a 2.0+  m filter is used, the camera is
effectively integrating on the back of the warm shutter
during a "hold", hence the background will rise rapidly.
- Break
: will break a sequence, the exposure currently being taken
will be lost, and no
further images will be taken in the sequence.
At the end of an exposure the image is transferred from the array
controller to the summit disk
and stored under the FITS file name that was automatically assigned to it.
Also, a copy of the file is sent
through the CFHT network down to Waimea, where it is automatically saved to
an archive optical disk. In
the event that data files are accidentally lost or deleted on the summit
disk, don't panic, make a note of the
file number, and have someone retrieve the file from the optical disk for
you.
Filters are controlled remotely through the Pegasus session. Though two coaxial wheels are in the
cameras, observers do not have to be concerned about wheel "logic" to manage filters. The data
acquisition computer makes sure that one wheel is always in an open position so the desired filter in the
other wheel is clear and in the optical path. To select a filter click on the "FILTERS" button in the main
menu. Along the left side of the FILTERS form are diamond shaped radio buttons that should be clicked
to select a filter. After making a selection, click on "Accept" to execute the change in filters. A pop-up
icon will appear with an hourglass to indicate that the wheels in Redeye are in motion. When this window
disappears, it is safe to proceed with exposures. Clicking on "Save values" will store the desired filter
configuration in the form but will not execute a motion after the form closes.
The MODES form allows the user to select automatic or manual image display after an exposure,
automatic or manual graphic display after an exposure, and to enable/disable the TCS link for proper
communication between the data acquisition computer and the Telescope Control System computer.
Crucial Information is passed through this link, including current telescope coordinates, astronomical
time, etc., hence it should only be disabled when it is necessary to reduce the system overhead to an
absolute minimum.
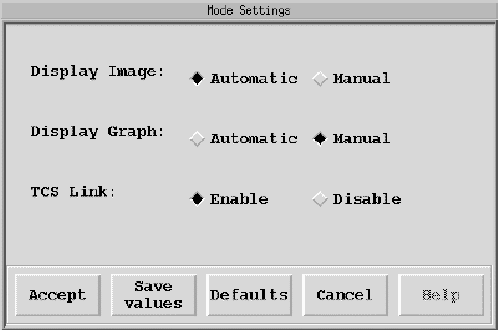
Figure 6.5 - The MODES control form is shown, which controls image display,
graphing functions, and the TCS link.
The IMAGE form allows the user to display the image of his choice. After selecting or editing the fields,
clicking "Accept" will start a new process call SAOimage with the following attributes:
- File name: image to be displayed. "current.fits" refers to the last image acquired, while
"previous.fits" refers to the image acquired just before the last one.
- Contrast: "Linear" or "Equalized Histogram". "Linear" will display the image scaled linearly
between a minimum and a maximum value computed automatically or entered manually (see "Level
setting"). "Equalized Histogram" will compute the image histogram, and select the display scaling based
on the histogram mode. It is usually best for seeing faint objects in an image.
- Level setting: "Automatic" will compute the min and max values in the image and adjust the
greyscale to map the full range of intensities. "Manual" will take the min and max values entered by the
user to map the greyscale.
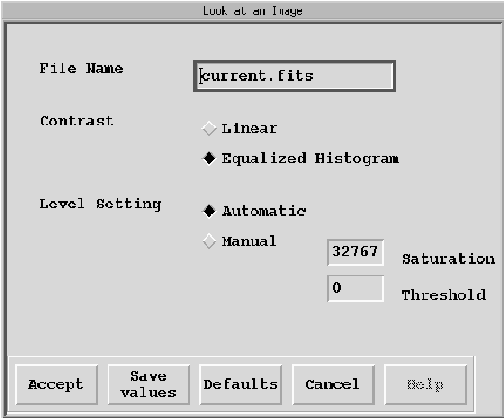
Figure 6.6 - The IMAGE control form is shown, which sets the attributes
of the image display session currently running.
Images are displayed with SAOimage, a display package originally created by Mike VanHilst at
the S.A.O. It is a stand-alone image display package with associated built in functions. The CFHT
version, "CFHTimage", has been modified to incorporate a few custom features primarily associated with
MOS/SIS.
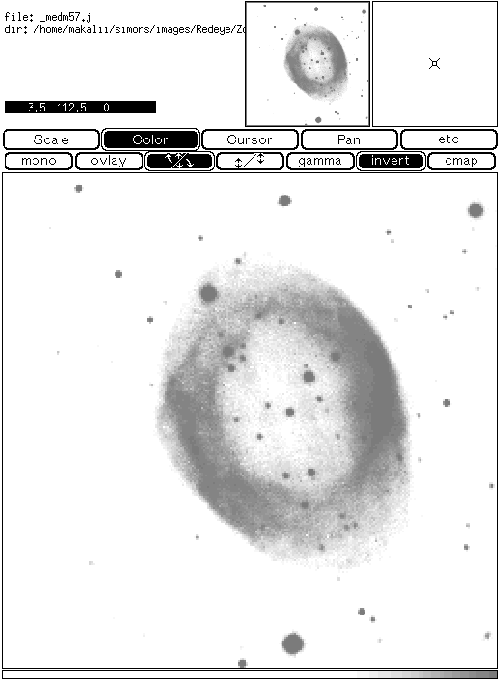
Figure 6.7 - An example of a Redeye image being displayed under SAOimage
is depicted.
Several different areas are evident in the SAOimage window. First, a large display area, which is
where the image is exhibited with the best resolution. Two small display areas are also used in the upper
right corner of the window. The small display on the left represents the full image in the memory buffer.
If a green box is in this display, this represents which part of the entire image is being seen on the large
display area (under pan/zoom). The small display on the right is a zoomed portion of the image around
the cursor. Changing the position of the cursor in the large display area changes the magnified view in
this small window. A menu bar above the large display area is available for controlling the program. A
greyscale is presented at the bottom of the window. The greyscale coding will change according to any
modification of the look up table. A set of cursor coordinates in the upper left window area is listed above
the large display area. When SAOimage is opened from "IMAGE", the coordinate display (i.e., X, Y
position and intensity value) will update as you move the cursor around the large display area.
For faint intensity levels select "scale" in the top menu bar, then "histeq" in the bottom menu bar. This
will apply a histogram equalization to the image, with emphasis on the mode of the histogram. Most of
the time, the mode of the histogram is close to the median sky level, so that the scaling is ideal for
revealing faint objects. The selection of "color" in the top menu bar allows the user to modify the image
contrast and thresholds by dragging the cursor in the main display area with the left mouse button. Note
that in the color menu, "invert" can be selected to flip the look up table so that white represents the lowest
value pixels. To see the highest intensity pixels in an image, select "scale", then "sqrt". This will compress
the intensities and the look up table, thereby displaying only the pixels with the highest values.
First select "Pan" in the top SAOimage menu bar. In order to pan around the image, position the cursor on
the image location that you would like to see in the middle of the display, then click with the left mouse
button and the selected image area will move to the center of the display. One can also use the full image
display in the top of the window to control panning. Specifically, dragging the green box with the left
mouse button to the desired region of the image, then releasing the mouse button, will update the image in
the main display area. Zoom is controlled in the bottom menu bar after the "Pan" button is clicked. A set
of zoom options ranging from ¼ to 4 are available. Clicking on any of these buttons will magnify the
image by the zoom factor. Alternatively, clicking with the middle mouse button in the main image display
yields progressively greater zoom levels. To unzoom click on "zoom1".
Other useful features in SAOimage include:
- New
: display a new image.
- Track
: the small zoom window is updated as the cursor is moved in the large display area.
This is set automatically when SAOimage is opened from "IMAGE" in Pegasus.
- Coord
: coordinate display is updated as the cursor is moved in the large display area. This
is set automatically when SAOimage is opened from "IMAGE".
- Print
: send image displayed to the laser printer. This typically takes ~ 30 sec for a Redeye
image on the summit Sparc printer.
- Quit
: quit and kill the SAOimage process.
The GRAPH form controls plots of cuts across an image. The control options include:
- Cutting Along
: X axis to cut along an array row, Y axis to cut along an array column.
- Cut # (1-2-3)
: up to three different cuts can be displayed simultaneously on the grapher
display. Clicking on the box below "Cut #" enables or disables the corresponding cut. For each cut you
have the following options:
- File Name
: the name of the file to be cut.
- Position of Cut
: the row or column number of the cut.
- Width to Average
: the number of rows or columns to be average into the cut.
- Subtraction Position
: grapher will subtract the columns/rows identified by the subtraction
position/width from the main cut defined above. This is quite useful for a quick sky subtraction from a raw
frame.
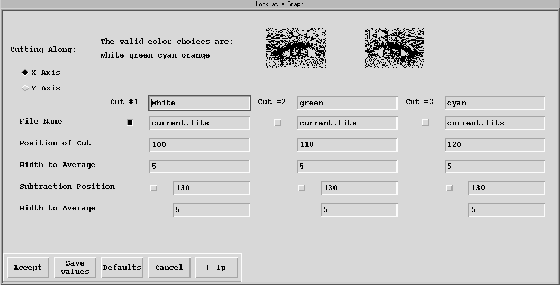
Figure 6.8 - The GRAPHER control form is shown. This tool creates line plots
of cuts across selected rows or columns in images.
GRAPHER is an interactive plotting program. The actual plot window opens after "Accept" is
selected in the GRAPH form. It provides the following possibilities (see Figure 6.9):
- Plots
: pop-up menu (press the left mouse button, and keep pressing while you browse
through the menu) allows reconfiguration of each plot, including file name, cut location, and subtraction.
- Options
: pop-up menu permits modification of the line type, computes statistics on the
graph, or adds labels.
- Print
: pop-up menu controlling print of the displayed graph to the summit or Waimea
printers.
- Zoom
: pop-up menu controlling a zoom factor from ¼ to 4.
- Show
plot: by clicking on the appropriate boxes, enables or disables the display
of the 4 possible overlaid plots.
- Scaling adjustment
: the program automatically adjusts the X and Y scales by clicking in
the "X scale" and "Y scale" boxes.
- Pan
: by either clicking or dragging the black horizontal bar at the bottom of the window, it
is possible to pan across the plot.
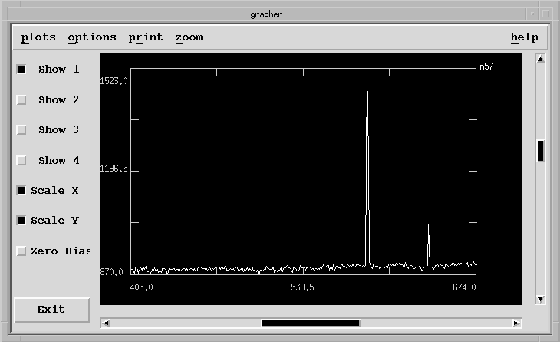
Figure 6.9 - An example of a grapher line plot is shown.
The IQE form controls the computation of various statistics from a FITS file. These include simple
minimum and maximum values, as well as more complex values such as mean, standard deviation, full-
width-half-maximum, and centroids. At the top of the IQE form is a large field for the FITS file name.
This is the file on which statistics are performed, and all locations, both entered and reported, will be
relative to this file in pixel units.
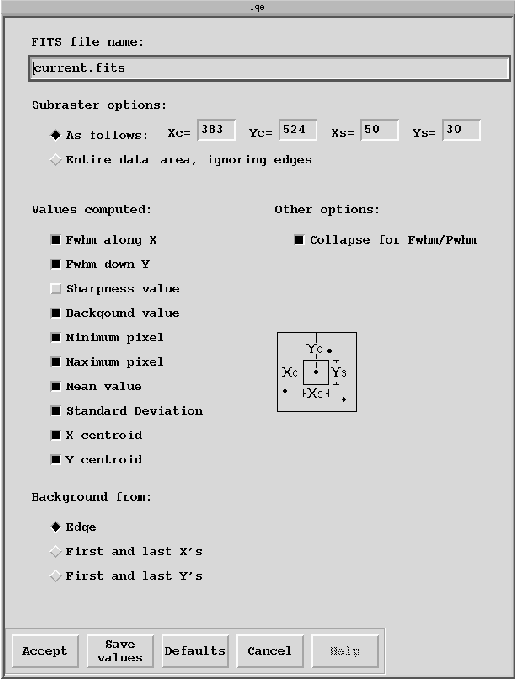
Figure 6.10 - The IQE form is shown. This tool reports basic statistics
of input FITS files and is particularly useful for quick assessments
of seeing or focus quality.
The subraster options are used to define the image region in which statistics are computed. The use of the
entire FITS file to compute statistics is not recommended, due to the nature of the calculations. For
example, the centroid values reported from a FITS file containing more than one star will be between the
stars! The user is responsible for selecting a subraster the only includes objects that statistics should be
computed on. To accomplish this, first select the radio button labeled "As Follows", and then fill the
desired values into the "Xc", "Yc", "Xs", and "Ys" edit fields. Use the picture in the lower right of the
form as a guide to the meanings of these variables. It is expected that you will use an image display tool
(SAOimage) to determine coordinate values. If the FITS file only contains the items you are interested in,
users can select the "Entire data area, ignoring edges" radio button.
Values computed: This area of the form is used to select the desired computed values, using a
list of check-boxes.
Background from: This list is used to define the background for FWHM computations. Values
can be generated as the mean of the entire edge of the selected area, which is normal for images. For
spectroscopic data, the use of the first and last X (or Y) values may give a better approximation of the
actual background. Selection is via a radio button.
Other options: The FWHM values are usually computed based on the maximum pixel's X and
Y coordinates. If the entire area selected is useful for the calculations, the "Collapse for FWHM/PWHM"
may be selected. This may be useful for spectroscopic data.
IQE output: After the "Accept" button is pressed, the computed statistics are presented in a
pop-up window, as text. After viewing the results, press the "Quit" button that appears across the bottom
of the this output window.
The FILES form allows 4 types of action on FITS files, namely
- List FITS files
: list the file names (default actions).
- List FITS Headers
: list the selected files' FITS headers.
- Write FITS files to tape
: write the selected FITS files to magnetic tape.
- Remove FITS files
: remove the selected FITS files from disk.
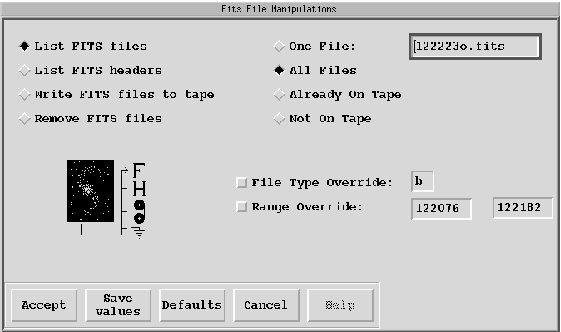
Figure 6.11 - The FILES control form is shown. This form is used to select
and then manipulate Redeye image FITS files.
The actual FITS files can be selected through several techniques using the FILES form. Specifically:
- One file
: perform the selected action on only one file after entering the file name in the
field reserved for it.
- All Files (default)
: performs the selected action on all the files in the directory.
- Already On Tape
: performs the selected action only on files which have been saved to
tape.
- Not On Tape
: performs the selected action only on files which have not been saved to
tape. If "All files", "Already On Tape", or "Not On Tape" have been selected, one can narrow down file
selection further by selecting one or both of the following:
- File Type Override
: performs the selected action only on the files with the file type of "o"
for object, "f" for flat, "b" for bias, or "d" for dark.
- Range Override
: performs the selected action only for the files with exposure numbers
falling in the range entered in the two dedicated fields.
After selecting the desired files and action, pressing the "Accept" button will execute the desired
action. As each file is processed, it is listed in a pop-up window. When the last file has been handled, a
message is displayed confirming this fact and the pop-up window can be closed with the "Quit" button. As
files are listed in this pop-up window, those that have been saved to tape will be surrounded by
parentheses. It is suggested that the "List Files" action be used to verify that the files desired have in fact
been selected and then bring the FILES form up again to perform any action.
To end the Redeye Pegasus session, click on "ALOHA" in the main menu bar.
This will bring up another
form which asks if you want to really quit ("Accept") or resume your session
("Cancel").
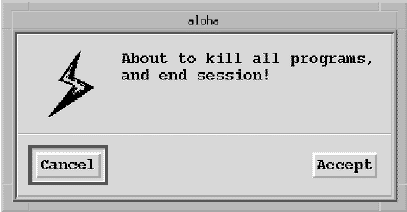
Figure 6.12 - The ALOHA form used to exit a Redeye Pegasus session is shown.


