5.1 GENERAL INFORMATION
5.2 COADDITION OF PRIMARY INTERFEROGRAMS
6. CREATING SECONDARY INTERFEROGRAMS
7. CREATING SPECTRA
8. PLOTTING DATA
9. RATIOING TWO SPECTRA
Appendix A. A Typical FTS File Image Header
Appendix B. FTS Data Reduction Program File Naming Conventions.
This manual describes how to use the Fourier Transform Spectrometer
Data Reduction Program, referred to as FTS. FTS is a partially
menu-driven program used in creating spectra from the primary
interferograms which are collected at the CFH telescope using the
Fourier Transform Spectrometer. When user input is
required there will either be a menu to select from or a prompt
will explain what information you must enter. Always press the
RETURN key after you've entered information at the terminal. When
your keyboard entry is invalid, the FTS program will allow you to
reenter the requested information again. Whenever a yes or no
response is elicited, pressing only RETURN is taken as a no
response.
The term scan is used frequently in this manual and refers to any
individual FTS data set. There are several major steps involved in
creating and evaluating spectra. The following list summarizes
these steps or main functions of FTS:
- Catalog of Scan Descriptions:
This function creates a file of pertinent
information extracted from the header record
of any FTS data file. There are three types
of data files: primary interferograms (mag
tape only), secondary interferograms, and
spectra. See Appendix A for a description of
the FTS header record.
- Coaddition:
Allows Coaddition of primary interferograms,
secondary interferograms, or spectra. A
maximum of 20 scans may be coadded at one
time. Compatibility checks are performed on
each scan to be coadded. Coadded primary
interferograms are automatically transformed
into a secondary interferogram.
- Secondary Interferogram Creation:
Transforms a primary interferogram into a
secondary interferogram. Many data validity
checks are made during this process which can
lead to a scan being rejected or suspect.
- Spectrum Creation:
Transforms secondary interferograms stored as
disk files into spectra. Spectra may be
plotted on a variety of devices during this
process or at a later time using function 5,
the plot data function.
- Plotting of Data:
Allows plotting of primary interferograms,
secondary interferograms, or spectra on a
variety of devices.
- Ratio Two Spectra:
Allows a spectrum to be divided by another
spectrum. The outcome is stored as a disk
file.
- Data Format Conversion:
Convert from FITS to IRAF data format, or from IRAF to FITS formats
There are four separate accounts for reducing FTS data: fts1, fts2,
fts3, and ftsx. The particular account to be used will
be assigned by the support astronomer, who will also provide a
password.
Once you have logged on to the Sun workstation, the FTS user accounts will automatically start up an FTS window and an IRAF
window (as well as several other tools) as shown below.
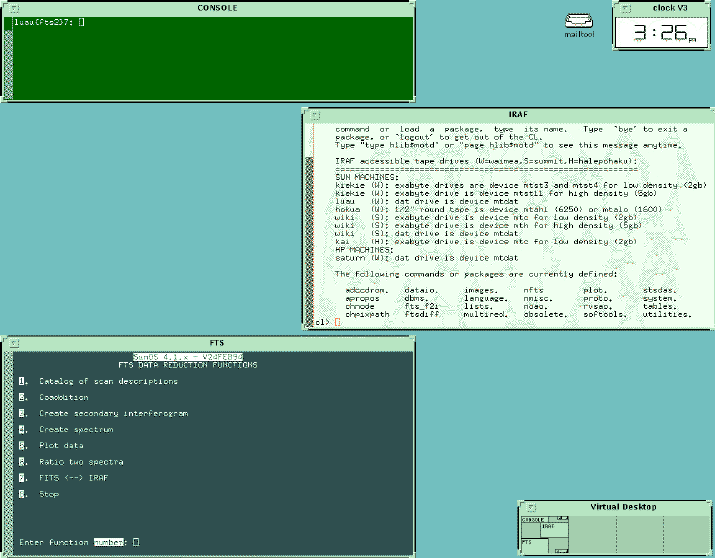
If either of the FTS or IRAF applications are exited, the corresponding window is removed. To start up
another FTS or IRAF window use the root menu selections. Simply hold down
the right mouse button somewhere in the background screen of the monitor and select ``Start FTS'' or ``Start IRAF.'' You can also start the FTS data reduction program from any xterm window: cd to the ``dat'' subdirectory first, and then enter ``fts''.
Note that raw FITS files are NOT copied to your home directory (which is located on the summit Sun, wiki, and is at
/summit/fts# where # is 1, 2, 3, or x, depending on which account you're using).
Instead, the raw FITS files are available in /users/observer/fts, an nfs mounted
file system hosted by an HP data acquisition machine at the summit.
You may NOT work in /users/observer/fts, but you may access the files:
copy the files to your ``dat'' directory to be worked on by the FTS program
or store the files on the Sun's exabyte tape.
Several aliases make moving to various subdirectories easier.
The alias ``cdfts'' moves the user into the /users/observer/fts directory,
while the aliases ``dat'', ``sum'', and ``home'' move the user to the
/summit/fts#/dat, /summit/fts#/sum, and /summit/fts# directories respectively.
There is a total of about 1.8 gb of user space available on wiki; check
disk space using the df command. If you are concerned about a possible shortage of disk space, contact your support astronomer.
The FTS data reduction account is able to send and receive email. You must, however, be on wiki to view mail.
Enter ``motday'' to see the message of the day at any time
To log out of the FTS data reduction account, select ``Exit'' from the root
menu.
The window labeled ``FTS'' is used to run the FTS
data reduction software. To activate input, use the mouse to position
the yellow arrow inside the boundaries of this window. The
menu which appears at startup is as follows:
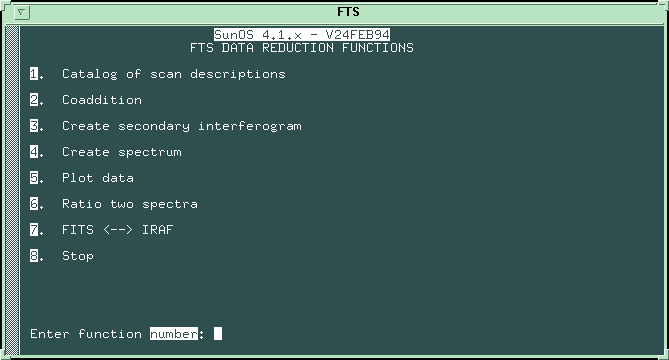
Simply enter the number corresponding to the desired function to
initiate a function from the main menu. You will be prompted for
any other information which is necessary to carry out the function.
When a function is completed you will come back to the main menu.
Most processes which may take more than a few seconds to complete
are described at your terminal by a message at the top of the
screen in reverse video. The term scan refers to any FTS data set.
The primary means of selecting scans for data reduction is by
specifying their scan number. A scan number is assigned to each
data set after conversion from FITS format (Chapter 3). It is an
8-digit number defined as follows:
- leftmost 2 digits = last 2 digits of year (e.g., 95),
- next 2 digits from left = month as number (e.g., 01 is January)
- the remaining 4 digits are the sequential creation position of
each scan during the current run, with the last 3 digits being the last three digits in the original FITS file. For example, if the FITS file number
is 301456o.fits and the data are acquired on 1995 January 1, then the scan
number after conversion to IRAF images will be 95010456. The fourth digit
from the right (a 0 in this example) is a flag that indicates various processing
steps.
When scans are coadded they are referred to by the scan number of
the first scan coadded (this number is entered in the file header).
Subsequent sections of this manual provide details concerning each
of the primary data reduction functions listed in the above menu.
Note, however, that some special routines we'll refer to as ``back door''
operations are activated by entering the number 20 at the main menu prompt.
Throughout this manual such operations will be clearly denoted as and indicated
in italics.
Four of the FTS functions (2, 3, 4, and 7 on the menu above) yield
disk files which contain summaries of what occurred during the FTS
function process. These summary disk files provide valuable
information, and they should be carefully evaluated to determine
such things as why a particular data set is suspect, why a scan is
rejected, which scans may be coadded, which scans to select for
further analyses, etc. These summary files are stored in a
separate directory from the data, which can be accessed by typing
``sum'' from any xterm window. All summary files have the extension of .SUM . The
summary file name starts on the left with one of the following
letters: E, C, or, P, corresponding to secondary, coaddition, or
spectra creation, respectively. The remainder of the file name
represents the following (from the left): the day of the month as
1 or 2 digits, the month as 2 letters (e.g., October is OT), the
year as 2 digits (e.g., 88), and the hour of the day as 2 digits.
Thus, E12DC8409.SUM denotes a summary of creating secondary
interferograms completed on December 12, 1984 at 9 a.m. Note that
January and June will use the same two month letters. See
Appendix B for more details concerning FTS file naming.
If you have logged on to an FTS data reduction account in Waimea then the Sun NEWSprinter 20 laser printer located in the computer room is the default printer.
If you have logged on to an FTS account from the summit SPARCstation (wiki) then the default printer is the summit laser printer, located in the 4th floor back observing room. Whenever printing is referred
to in the remainder of this manual it is implied that the
one of these two default printers is being used. If it is necessary for you to use
another printer, please contact your support astronomer or the FTS data reduction program manager, Bob Link.
The raw data are recorded in FITS format and must be translated
into IRAF images before they can be used by the FTS data reduction program. This is
done using option 7 from the main menu: FITS < - > IRAF . After
selecting this option, the following menu will appear:
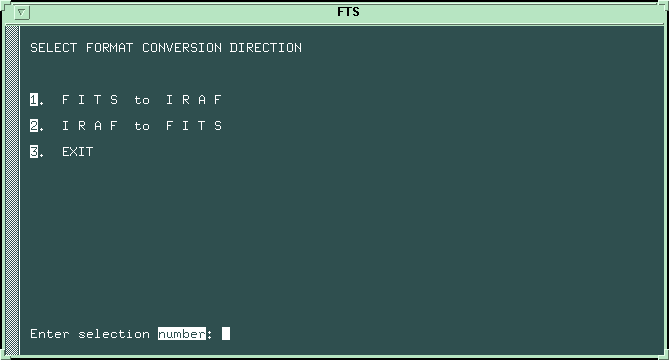
If you choose to convert from FITS to IRAF formats you are prompted for
the FITS file name (a ``.fits'' extension is assumed). A wild card (``*'')
may be used to convert more than one file at once.
Once a FITS file has has been converted to IRAF format the original FITS file is renamed so that it has a ``.cnvt'' suffix, rather than the original ``.fits''
suffix. A summary file with a list of files converted can also be found in
the ``sum'' directory.
At the present time a built-in IRAF to FITS converter is not implemented with
the FTS data reduction program, so when you request a conversion from IRAF to
FITS formats you are simply instructed to use IRAF's ``wfits'' routine.
Once you have converted your FITS files into IRAF images you can use the
IRAF window and IRAF's
various packages to view your raw data, examine the FITS headers, etc.
A catalog of a scan or data set is a listing of pertinent file
header record information such as scan number, number of sample
points, and observer's comments (see Appendix A for complete
description of header). A catalog may be made of any type of FTS
data set: primary interferogram, secondary interferogram, or
spectrum.
Cataloging primary interferogram data files is usually the first
action taken in the data reduction process. This information is
helpful in selecting specific scans for further analyses and in
identifying unusable or suspect data sets.
To view the headers of any data files (after they have been converted to
IRAF format) simply type ``imhead file_name lo+ | page'' in the IRAF
window. If you want to print the headers to the default printer enter
``imhead file_name lo+ | lprint''. Type ``phelp imhead'' for more help
on the IRAF imhead package.
You may coadd primary interferograms, secondary interferograms, or
spectra. Secondary files to be coadded may be any combination of
previously coadded primary or secondary data, or individual
secondary scans. All scans coadded are tested for compatibility;
compatibility criteria are discussed below. A coadded scan file
will take on the scan number of the first scan coadded as its
identifier. The data file header record is updated to reflect
coaddition. For example, the number of scans coadded, and the type
of scans (primary, secondary, or spectra) are added to the header
upon successful completion of the coaddition process. (See
Appendix A for a description of the FTS header record.) Once you've
chosen the COADDITION function (number 2 on the main menu), you
will select the appropriate coaddition procedure from the following
menu:

Selection 6 will eventually provide a brief description of the coaddition process
on the screen, but this help option has yet to be implemented.
Selection 7 returns you to the main FTS function
menu.
Coaddition of primary interferograms is accomplished by selecting
1 or 2 from the previous menu. If
beam switching was used (usually the case for observations beyone 2.5 microns,
or in the thermal infrared) then select option 1.
If your scans were obtained without beam
switching (normally the case in the nonthermal infrared) then select 2.
Any data
collected in beam switching mode must be coadded as primary data.
Files to be coadded must have been recorded sequentially in time.
You will enter the entire first and last scan numbers to be
coadded, and the coaddition will proceed without user intervention
unless a problem occurs. There is a limit of 20 scans for one
coaddition procedure.
Coaddition of primary data is a weighted accumulation of
corresponding sample points. The scans are weighted by their
signal-to-noise ratios (S/N) and the ratios of their intensities. An
intensity, in this case, is 1/2 the peak-to-peak signal at the
central fringe of the Zero Path Difference (ZPD) area in the set of
interpolated points
used to locate the ZPD. When the scan contains less than 6 data
records (1536 points), the S/N is set to 1.0 as the calculation is
likely to be unreliable. If the S/N for scans with more than
6 records is suspect, a warning will be printed out in the summary
file. A future revision may be made that would skip scans for
which a S/N is not computed, or a provision made to allow coadding
nonadjacent scans. Currently, if the user does not want to
include a scan with a pseudo-weight of 1.0, then more than 1 set of
primaries should be coadded (skipping the unwanted scan(s)). These
sets can then be coadded as secondary interferograms or spectra.
There are a number of compatibility checks performed on each scan:
same number of sample points, same object names, same step size,
same internal modulation, and the same zero path difference
location within a small tolerance. If selection 2 is chosen (no beam
switching) and a beam switching flag is found in the scan's header, then
coaddition will be stopped. Data collected with beamswitching must
be in pairs of forward and reverse scan directions. Note that
these pairs are combined via subtraction prior to the weighted
accumulation process described above. If beam switching has been
stipulated (selection 1), only the first header is checked for a
beam switch flag. If none exists, then the user is notified and
asked if the program should continue. This capability to continue
is allowed in case a manual beam switch mode has been used; in this
mode the header is currently not flagged as beam switched during
data acquisition. Any time coaddition is stopped, the user has the
option of saving those scans which have been successfully coadded,
assuming, at least, 2 scans have been coadded.
Once you have entered the numbers of all
of the primary interferograms to be added, you are given the option of
plotting the primary interferogram. Simply enter the range of indices (steps)
to plot and enter a 0 or negative value to stop. The interferogram is
then interpolated near ZPD and you can then plot the interpolated values.
Assuming no problems have occurred during the actual coaddition,
the coadded data set is then automatically transformed into a
secondary interferogram.
Before finishing, you have the option of
plotting a specified range of the secondary interferogram, as well as the end of the interferogram. Simply enter the range of indices (steps)
to plot and enter a 0 or negative value to stop.
A summary disk file is also created and should be evaluated and,
perhaps, printed out as a record of what occurred. The summary
report will not only include information concerning the scans which
were coadded, but also a detailed report on the secondary creation
process (see section 6.4 or Appendix E for more details on the
secondary summary report). Prior to returning to the main FTS
menu, a summary file disposition menu will appear which allows the
user to type, print, delete, close, or ignore the currently opened
summary file:

Section 3 on the coaddition procedure menu allows coaddition of
secondary interferograms.
At this time you will be asked to enter the scan number (8 digits)
of the first secondary scan to coadd. Any type of secondary data
(individual or coadded data) may be coadded. Remember that coadded
scans are identified by the first scan number coadded. There is a
limit of 20 scans for one coaddition procedure. You must now
specify if the scan contains coadded data (yes/no). If the scan
does contain coadded data, you must then select the type of data
coadded from a list which is presented to you (only primary scans,
single and coadded scans, or all other combinations). This
information is needed to locate the correct disk file. See
Appendix B for details concerning FTS disk data file naming. Since
the disk files are independent entities, you must repeat this
sequence of entries for each scan to be coadded. Once the first
scan is coadded, you may enter a shortened scan number for other
scans to be coadded; just enter the rightmost 4 digits (skip year
and month), less any leading zeroes. Of course, this assumes the
year and month digits remain the same. To end coaddition, simply
press the RETURN key in response to the request for the next scan
number to coadd.
There are fewer restrictions on secondary data which is coadded
than with primary data. Scans are currently weighted by their
S/N and the ratio of their intensities, unless the
number of sample points is different. Scans with unequal number of
sample points are coadded by means of a blending algorithm
developed by J.-P. Maillard. This is referred to as the old
method and will be updated to the S/N weighting scheme in the
future.
If the S/N of a scan has not been computed (as indicated in
its header), then the user will be asked to decide if a weight of
1.0 should be used or if the old method should be used. This
applies to scan with equal numbers of sample points; there is no
choice if the number of points is unequal.
Prior to coaddition, scans are checked for equal step sizes, equal
internal modulation amplitudes, and use of the same entrance port of the
FTS (data
collected via beamswitching must be coadded as primary data).
After the secondary interferograms have been coadded you are given
the opportunity to plot the result. Simply enter the minimum and maximum
indices (step values) to plot and select the desired output device. See
Chapter 8 for more detailed information on how
to plot your data.
Since these disk files already represent secondary data there is no
need to finish the process with secondary interferogram creation as
in coadding primary data. A summary disk file is also created and
should be evaluated and, perhaps, printed out as a record of what
occurred. The summary file contains information concerning the
scans which were coadded. Prior to returning to the main FTS menu,
a summary file disposition menu will appear (see section 5.2.5) which allows the user
to type, print, delete, close, or ignore the currently opened
summary file. See Appendix E for a typical summary disk file
listing.
Coaddition of spectra is initiated by selecting 4 from the
coaddition procedure menu.
At this time you will be asked to enter the scan number (8 digits)
of the first spectrum to coadd. Any type of spectral data may be
coadded. Remember that coadded scans are identified by the first
scan number coadded. You must now specify if the scan contains
coadded data (yes/no). If the scan does contain coadded data, you
must then select the type of data coadded from a list which is
presented to you (only spectra, only primary scans, single and
coadded scans, or all other combinations). This information is
needed to locate the correct disk file. See Appendix B for details
concerning FTS disk data file naming. The file extensions detailed
in Appendix B are useful is specifying the type of data coadded.
Since the disk files are independent entities, you must repeat this
sequence of entries for each scan to be coadded. Once the first
scan is coadded, you may enter a shortened scan number for other
scans to be coadded; just enter the rightmost 4 digits (i.e., skip the year
and month), less any leading zeroes. Of course, this assumes the
year and month digits remain the same. To end coaddition, simply
press the RETURN key in response to the request for the next scan
number to coadd. There is a list of 20 scans for one coaddition
procedure.
Spectra are normally weighted by a ratio of their S/N and a ratio of their intensities. Before the second scan to
coadd is requested, you are asked if you wish to enter a multiplier
of each scan after the first one. If you select NO, then the
question will not be asked again. If YES is selected, then you
must enter a multiplier for each scan except the first and the
ratio of intensities will not be used in weighting. The SN's are
always used in weighting.
From this point on, the only user intervention is entering the scan
numbers until coaddition is completed, unless you've chosen to
enter values for multiplying each spectrum as described above.
When the spectrum coaddition is complete, the signal-to-noise (SN)
is calculated. The maximum signal is one component of this
calculation. It is possible that the maximum signal is accurate
(too high), e.g., an extra signal riding on top of the spectrum.
In order to avoid inappropriate maximums, and thereby reduce the
accuracy of the SN, the FTS program will now allow you to specify
the wave number range for the search of the maximum signal. The
values must be within the filter limits. RETURN implies using the
full range of values for the search, i.e., the filter limits.
At this point, you have the option of plotting the spectrum either
on the screen or on a laser printer. Whether or not the coadded
spectrum is plotted at the time of its creation, you may use FTS
function 5 (PLOT DATA) to plot it at a later time, assuming the
spectrum is saved on disk. See chapter 7 (PLOTTING DATA) for more
details concerning the plotting of spectra.
Spectral compatibility checks are made for equal step sizes, equal
internal modulation amplitudes, use of same filter number, same
number of transformed points, and same number of original points
(from the secondaries) +/-1of original points may be increased in the future.
A summary disk file is also created and should be evaluated and,
perhaps, printed out as a record of what occurred. The summary
file contains information concerning the spectra which were
coadded. Prior to returning to the main FTS menu, a summary file
disposition menu will appear which allows the user to type, print,
delete, close, or ignore the currently opened summary file. See
Appendix E for a typical summary disk file listing.
Function 3 of the main menu initiates the creation of a secondary
interferogram. Essentially the secondary interferogram is the
rightmost portion of the interferogram, starting from the zero path
difference (ZPD). The process involves performing several checks
on data validity, estimating the ZPD, and reconstructing the
rightmost portion of the interferogram. A secondary interferogram
file is the required input format for the final step of creating
spectra.
The next inquiry concerns specifying the scan number of the scan to
be transformed. If you enter zero (0), then the function is in
CONTINUOUS MODE . If you enter a specific scan number, then the
function is in NORMAL MODE . These modes are described in the
following two sections. Note that when you enter a
specific scan number you also have the option of permanently
changing the scan number by entering a new number right after the
current one (separating them with a blank or comma). This is
useful if there was some error in numbering scans during data
collection.
In this mode you must enter the scan number of each data set to be
transformed. It is helpful to use a catalog of the primary
interferogram data as a guide in selecting scans at this point.
Once the scan is located, your input is required at several points
which are described below. After the first scan has been
transformed, you may enter a shortened scan number for other scans;
just enter the rightmost 4 digits (skip year and month), less any
leading zeroes. Of course, this assumes the year and month digits
remain the same. To end secondary interferogram creation, simply
press the RETURN key in response to the request for the next scan
number.
A data acquisition option exists which allows the creation of
symmetric scans, a mode frequently used with low modulation data.
This type of scan contains enough data on both sides of the ZPD
such that the two sides can be coadded. This coaddition is done
transparently when a flag is found in the scan header indicating
that this mode has been used. The only required user input
associated with a symmetric scan is the response to a question
asking if a scan flagged as symmetric is indeed symmetric. Since
this type of data mode is relatively new, the question alerts the
user as to what is happening and also allows the scan to be reduced
normally. This question will probably be deleted sometime in the
future. A message is entered into the summary file whenever a scan
is found to be flagged as symmetric; the messages states whether
the scan was analyzed as symmetric or not.
You are asked how many records to evaluate in the present scan.
The normal response is all records, which is indicated by just
pressing RETURN . If you have determined that data at the end of
the scan should be discarded, you may discard it by entering an
appropriate number of data records to evaluate. Note that you are
entering the number of records to keep, NOT the number to
eliminate. Secondary data records contain 256 values, except the
last record, which contains 256 or less values.
You have the option of plotting the raw data, i.e., primary
interferogram. You designate the range of sample points to plot
and whether the terminal or laster printer is the destination
device. See Chapter 8 for details
concerning plotting on either device. You may create as many plots
as desired of the raw data; entering a zero or negative number
stops the plotting of the current primary data set.
During the evaluation of the primary interferogram the data is
checked for fringing. If an interval of data is found which
possibly contains fringing, you have the option of attempting
fringe correction (yes/no). If you respond yes , there are a
number of entries you must make. See Chapter 7 for details; the only difference is that you won't be
specifying the fringe locations here, they are found by the
program. In practice, the current algorithm for detecting fringing
has been found to be too insensitive. Thus, the fringe
correction option has been added as the first step in creating a
spectrum. If a modification is made to the data to correct
fringing, then 1000 is added to the scan number and the header is
flagged to indicate that defringing occurred.
An intermediate step in creating a secondary interferogram is the
creation of an array of approximately 3000 points representing a
detailed interpolation of the 300 primary sample points surrounding
the estimated ZPD location. This set of points is used for testing
anti-symmetry, for more precisely locating the ZPD, and for
calculating values necessary in reconstructing the right half of
the interferogram. Once the interpolated data is created and
evaluated you have the option of plotting it in the same manner the
primary data was plotted.
As the secondary interferogram is created you may optionally plot
the first part of it. This will be less than or equal to
10,000 points. Usually only the first few hundred points are of
any interest at this time. As with plotting primary data, you
specify the range of values and then a destination device from a
list presented to you. If you desire to plot sections of the
secondary data which were not available at this time, you may plot
them using function 5, PLOT DATA, once the secondary disk file has
been created.
Entering a 0 (zero) in response to the prompt requesting a scan
number to transform puts the program in CONTINUOUS MODE . In
continuous mode a range of files (specified with an appropriate wildcard) are transformed into secondary
interferograms without any user intervention. All data file
records are used and no plotting is allowed in continuous mode.
This is a timesaving option when first evaluating the primary data
as the user need not enter scan numbers, nor respond to prompts
concerning how many records to use, plotting, or fringe correction.
Possible fringe areas are still flagged in the summary file. After
reviewing the summary listing (see next section), one can go back
and reanalyze any specific scans in more depth.
A detailed summary report is created as a disk file for scans
transformed into secondary interferograms. See Chapter 2
concerning the access of the summary disk files. You should
carefully evaluate the summary listing (usually in conjunction with
your observing notes) for such things as why a scan was rejected by
the FTS program, should a scan be rejected that wasn't, and which
scans can be coadded. Many of the data validity checks in the FTS
program are based, in part, on the empirical results of previous
Fourier Transform Spectrometer observations and, thus, are not
perfect. In most cases, scans not meeting FTS validity criteria
will be rejected (no secondary interferogram will be created). One
exception is the evaluation of the anti-symmetry of the
interferogram. Two anti-symmetry ratios are presented in the
summary report: one for the central portion (surrounding the ZPD)
of the interpolated points, and one for the tails of the
interpolated points (see section 6.2.5). Previous results indicate
that a ratio of .99 or higher for the ZPD area and .90 or higher
for the tails are the typical values for most acceptable scans.
However, the FTS program does NOT reject a scan for ratios below
these levels. Instead, an additional message is printed out along
with the actual values.
Prior to returning to the main FTS menu, a summary file disposition
menu will appear which allows the user to type, print, delete,
close, or ignore the currently opened summary file. See Appendix E
for a typical listing of the summary file generated for secondary
interferogram creation.
Creating the final spectrum requires a secondary interferogram
stored on disk as the input. A minimum of 16k points are produced
for the final spectrum.
Once you've selected the output medium you will be prompted for the
scan number of the input file (a secondary interferogram). After
entering the appropriate 8-digit number you must now specify if the
scan contains coadded data (yes/no). Any type of secondary data
may be transformed into a spectrum. Remember that coadded scans
are identified by the first scan number coadded. If the scan does
contain coadded data, you must then select the type of data coadded
from a list which is presented to you (only primary scans, single
and coadded scans, or all other combinations). This information is
needed to locate the correct disk file. See Appendix B for details
concerning FTS disk data file naming. Since the disk files are
independent entities, you must repeat this sequence of entries for
each scan to be transformed. Once the first scan is complete, you
may enter a shortened scan number for other scans to be
transformed; just enter the rightmost 4 digits (skip year and
month), less any leading zeroes. Of course, this assumes the year
and month digits remain the same. To end spectrum creation, simply
press the RETURN key in response to the request for the next scan
number to transform. The header information concerning coaddition
is carried onto the spectrum header.
At this time, you have the option of attempting fringe correction
(yes/no). If you have evidence that fringes are present in the
secondary interferogram, then you may try to reduce the effect of
these fringes on the spectrum by using this procedure.
After a yes response to the attempt fringe correction inquiry,
the user must enter a sample point which locates a fringe area.
You need to carefully evaluate the interferogram to locate the
fringe(s) prior to creating the spectrum, if fringe corrections is
to be attempted. There is no limit on the number of fringes
corrected. Once you've finished evaluating an area, the program
will come back to the question of specifying a sample point. A
RETURN will exit the defringing option.
If a valid sample point is entered to locate a fringe area, the
user then presses the RETURN key to view a plot of the fringe area.
The fringe area corresponds to the specified sample point
+/-150 points. Note that this area will be reduced if the
specified fringe sample point is less than 151. The plot of this
area will remain on the screen until you press RETURN. While the
plot is on the screen, select 2 boundary points which define the
interval of points in which defringing should occur. After
pressing RETURN, the plot will disappear, and you will then enter
the 2 boundary points. extreme values within the boundaries
(defringe area) are set to zero. The extreme values are those
points which are more extreme than the maximum and minimum values
found in the data adjacent to the user defined defringe area. This
adjacent data is simply the points in the suspected fringe area
(301 points) outside the boundaries you've chosen. For example, if
you select 500 as the initial sample point locating the interval to
be defringed, then you will be presented with a plot of the points
350 to 650 from which the boundary points must be selected.
Suppose the points 480 and 550 are then entered as the boundary
values. The adjacent areas are then the intervals 350 to 479 and
551 to 650. The next section explains how you may further control
the adjacent area(s) used for determining the cut-off values. You
must select boundary values which allow at least 10 sample points
in the 2 intervals which make up the adjacent data. Usually the
boundary points selected leave many more points in the adjacent
data than 20. A RETURN without specifying boundary points exists
the defringing option for this interval with no modifications
made.
After selecting the 2 boundary values, the user decides if both the
adjacent areas, the left side only, or the right side only should
be used for finding the cut-off values to be used in defringing
between the boundary values. To provide flexibility, the user now
specifies how many points should be used in the interval(s) used
for finding the cut-off values.
The complete interval of 301 points containing the new defringed
data is now plotted for your inspection. Press RETURN after
you've inspected the plot, and answer the question concerning the
acceptability of the modification (yes/no). If the defringing is
acceptable, then you will come back to the question of specifying
a sample point to locate another area to possibly defringe. As
mentioned above, a RETURN here ends fringe correction. A decision
that the correction is NOT acceptable leads to a plot of the
original data in the specified interval. You may now try another
correction on this area or press RETURN to stop evaluation of this
area with no modifications.
If any data has been modified, then a new secondary interferogram
file is created with the new data. This new file is used in
creating the spectrum; the original file is saved untouched. The
header of the new file is flagged to signify that defringing has
occurred, and the scan number is changed; 1000 is added to the
original number, thus incrementing the fourth digit from the right
by one.
The number of sample points to transform is now requested; the
number of point which exist is presented on the screen. Typically,
all the points are used which is indicated by pressing RETURN .
If you select fewer points to transform, then the fourth digit from
the right in the scan number will be changed to help identify the
san as a low resolution spectrum. If defringing has been done on
the secondary, then an 8 will be used in the scan number
(note: this means that this new scan number will not agree with its
associated defringed secondary scan number). If no defringing has
occurred, then a 9 is placed in the fourth digit from the right.
Hopefully, this scan renumbering makes it easier to differentiate
among spectrum disk files.
When the spectrum creation is complete the signal-to-noise ratio
(SN) is calculated. The maximum signal is one component of this
calculation. It is possible that the maximum signal is inaccurate
(too high), e.g., an extra signal riding on top of the spectrum.
In order to avoid inappropriate maximums, and thereby reduce the
accuracy of the SN, the FTS program will now ask you to specify the
wave number range for the search of the maximum signal. The values
must be within the filter limits. RETURN implies using the full
range of values for the search, i.e., the filter limits.
At the end of the spectrum creation process you have the option of
plotting the spectrum on the terminal or laser printer. Whether or
not the spectrum is plotted at the time of its creation you may use
FTS function 5 (PLOT DATA) to plot it at a later time if the
spectrum is saved on disk. See the next chapter (PLOTTING DATA)
for more details concerning the plotting of spectra. See
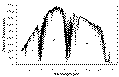
Appendix F for a spectral plot example.
The summary report for spectra creation is note as detailed as the
report for secondary creation, since there is no data validity
analyses. The report contains primarily information which is
relevant to describing and plotting the spectrum (this information
is added to the data file header record), e.g., the free spectral
range value. Prior to returning to the main FTS menu, a summary
file disposition menu will appear which allows the user to type,
print, delete, close, or ignore the currently opened summary file.
See Appendix E for a typical spectral creation summary report.
During the course of reducing Fourier Transform Spectrometer data
you will want to plot secondary interferograms, and spectra (you
have the option of plotting the previously mentioned data sets
during their creation). The PLOT DATA function allows you to plot
any primary or secondary interferograms, as well as spectra. A
summary file is not created as a result of using this plot
function. See Appendix F for examples of all types of plots.
These plots have been reduced in size, using the FTS size reduction
option, to fit on one manual page. Seek the advise of CFHT
software personnel if you have questions concerning plot devices.
After selecting PLOT DATA (number 5) on the FTS function menu, a
plot data type menu as follows will be presented:

The following sections discuss the details of plotting the three
data types in the above menu. Selecting number 4 on the menu
returns you to the main FTS function menu.
The user is prompted for the scan number (8 digit number) to plot.
You may plot as many primary data sets as you desire; plotting is
stopped by pressing RETURN in response to the scan number
inquiry.
Now you are asked to ENTER THE MINIMUM AND MAXIMUM INDICES TO
PLOT , followed by your selection of the plot device. You may plot
as many sections of the current data set as desired on any plot
device.
The plot will appear on a graphics window separate from the CFHT
FTS window. When the plot is complete, you may continue plotting
the same data set or you can enter zero or a negative number to end
plotting of the current data set.
If the laser printer is selected as the output device, then the
plot is forwarded to the laser printer attached to the SUN
system.
Once plotting of the current data set is stopped, by entering a
zero or a negative number in response to the ENTER MINIMUM AND
MAXIMUM INDICES TO PLOT prompt, you are asked for another scan
number to plot. You may continue plotting by entering a scan
number, or press RETURN to end primary data plotting and return
to the main FTS function menu.
Selecting secondary data to plot (section 2) is followed by an
inquiry as to the scan number (8 digit number) to plot. You may
plot as many secondary data sets as you desire; plotting is stopped
by pressing RETURN in response to the scan number inquiry.
Remember that coadded scans are identified by the first scan number
coadded. You must now specify if the scan contains coadded data
(yes/no). If the scan does contain coadded data, you must then
select the type of data coadded from a list presented to you (only
primary scans, single and coadded scans, or all other
combinations). This information is needed to locate the correct
disk file. See Appendix B for details concerning FTS disk data
file naming. The file extensions detailed in Appendix B are
helpful in specifying the type of data coadded and are presented in
the question above. Since the disk files are independent entities,
you must repeat this sequence of entries for each scan to be
plotted. Once the first scan is plotted, you may enter a shortened
scan number for other scans to be plotted; just enter the rightmost
4 digits (skip year and month), less any leading zeroes. Of
course, this assumes the year and month digits remain the same.
Again, to end plotting, simply press the RETURN key in response
to the request for the next scan number to plot. Your input
necessary to compete the plot is the same as plotting primary data
(the previous section) starting at the ENTER MINIMUM AND MAXIMUM
INDICES TO PLOT prompt.
You will be asked to enter the scan number (8-digit number) of the
spectrum file. You may plot as many spectra as you desire;
plotting is stopped by pressing RETURN in response to the scan
number inquiry. Remember that coadded scans are identified by the
first scan number coadded. Now you are asked if this scan is made
up of coadded data (yes/no). If the scan does contain coadded
data, you must then select the type of data coadded from a list
presented to you (only spectra, only primary scans, single and
coadded scans, or all other combinations). This information is
needed to locate the correct disk file. See Appendix B for details
concerning FTS disk data file naming. The file extensions detailed
in Appendix B are helpful in specifying the type of data coadded
and are presented in the question above. Since the disk files are
independent entities, you must repeat this sequence of entries for
each spectrum to be plotted. Once the first spectrum is plotted,
you may enter a shortened scan number for other spectra to be
plotted; just enter the rightmost 4 digits (ski year and month),
less any leading zeroes. Of course, this assumes the year and
month digits remain the same. Again, to end plotting, simply press
the RETURN key in response to the request for the next scan
number to plot.
Now you must enter the wavenumbers defining the section of the
spectrum you want plotted (the free spectral range limits are
present on the screen at this time). You may plot as many sections
of the current spectrum as you like. Entering a NEGATIVE number in
response to the wave number inquiry stops the plotting of the
current scan and brings you back to the request for a spectrum scan
number. At this time you may plot another spectrum or stop
plotting spectra and return to the main menu.
PLOTTING ON YOUR TERMINAL:
The results are output on a graphics window separate from the CFHT
FTS window. Prior to plotting the result, the apodization level
(0 to 4) must be specified for plot interpolation. Level 0
corresponds to no apodization. The apodization value affects the
shape of the since function used in interpolating the spectrum
data. The interpolation algorithm yields 5 points for ever
original point. If more than 2000 points are to be plotted, you
then have the option of plotting all the points or a sample of
about 1000 points equally spread throughout the full set of points.
The plot will now be made without further intervention.
LASER PLOTS:
If the laser printer is selected as the output device, then the
output is forwarded to the laser printer attached to the SUN
system. As with terminal plots, the apodization level (0 to 4)
used for interpolation must be specified. Level 0 corresponds to
no apodization. The apodization value affects the shape of the
sinc function used in interpolating the spectrum data. The
interpolation algorithm yields 5 points for every original point.
Interpolation may take several minutes if there are many points to
plot and/or the computer system is busy.
If more than 2000 points are to be plotted, you then have the
option of plotting all the points or a sample of about 1000 points
equally spread throughout the full set of points. Just answer yes
or no to the inquiry about plotting a sample. The plot is then
started. The Enter 1st and last wavenumbers for plot prompt will
now reappear.
The intensity distribution of the raw spectra contain features due
to atmospheric absorption and filter response. These can be
removed by ratioing spectra with that of a star with a featureless
spectra (e.g. an early G dwarf or sub-dwarf). After selecting
option 6 on the main menu, the user is asked to enter the two
spectra to ratio; the first entry is the dividend, while the second
is the divisor. The user is then asked to specify a threshold .
If the absolute value of the quotient exceeds the threshold, the
data at that point is set to 0.
As processing of a given scan continues, the original completely numerical
scan number is modified with various prefaces and suffixes. A summary
is given below: