


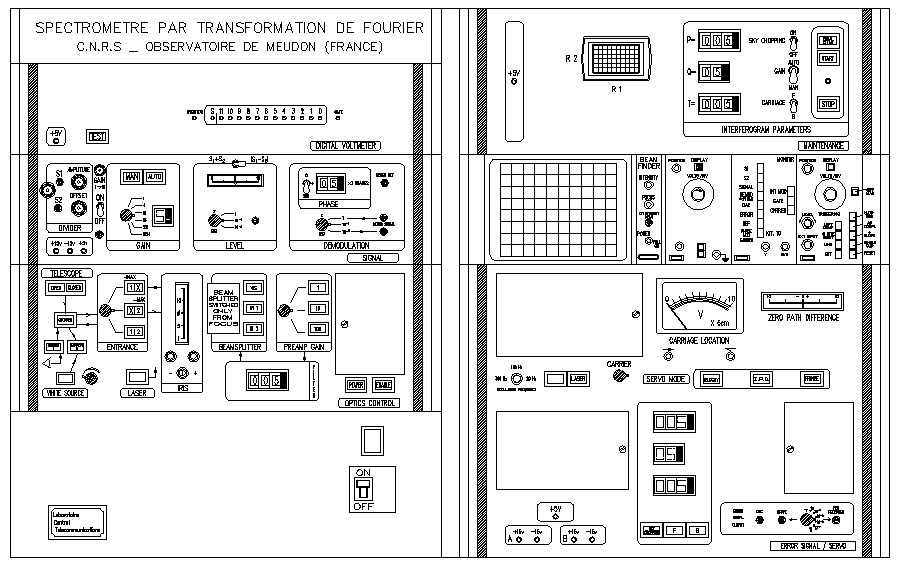
 The general layout of the master control panel is shown in Figure
3.1. The control panel can be subdivided into 4 areas, each of which has
a separate function. In the subsequent discussion, these areas will be
referred to as (1) instrument setup, (2) data acquisition control,
(3) servo control, and (4) instrument status. Detailed close-ups of each
area
are shown in Figures 3.2, 3.3, 3.5 and 3.6


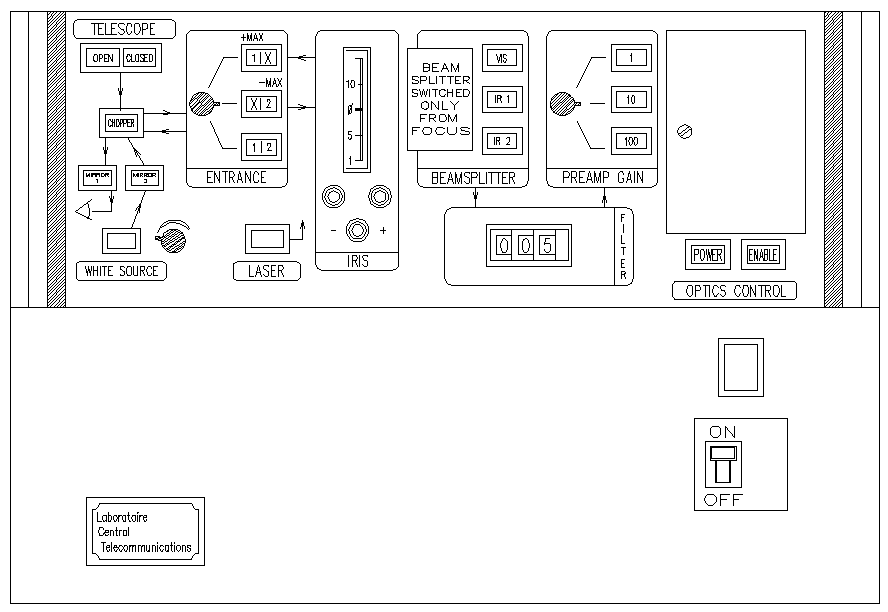


 The FTS optics control panel is illustrated in Figure 3.2 and its various
functions are described below.
- On/Off: Controls power to the master control panel. However,
to access all functions the optical control must also be `enabled'
(see discussion concerning the `Enable/Disable' switch).
- Enable/Disable:
When this toggle is enabled the instrument optics can
be controlled from the master control panel. When disabled,
control defaults to the Auxiliary Control Panel.
- Open/Close:
Opens the entrance aperture of the FTS.
- Mirror 1: This switch inserts a mirror at entrance #1 of the instrument.
When in place, this entrance is blocked from the sky and light is
directed from inside the instrument to an eyepiece. This mode is
generally used in conjunction with the auxiliary laser. In certain
instances this mirror can also be used to confirm that a star is in the
field of view of the instrument and assist in Hot Spot. Then mirror 1 must be flipped in and the entrance
switch (see below) set to position X | 2. When the telescope is pointed at a
bright star (V
 ), the star should be visible in the eyepiece. If the star
is then centered in the middle of a vertical dark groove in the viewing
mirror then the star is also well centered in the entrance #1 of the
FTS. For observing conditions the mirror 1 switch must be off.
- Mirror 2:
This switch inserts a mirror at entrance #2 of the instrument. When in
place, this intrance is blocked from the sky and light from the white
light source (see below) is directed into the interferometer. For
observing conditions this switch must be off.
- White Source:
Turns on the white light source. The strength of the source
is controlled with the rheostat to the right of the switch. The white
light
source is used primarily for engineering applications, but can also be
used to
find ZPD in the absence of a bright source on the sky (see Section 4.4).
- Entrance:
There are three settings for this switch: `1 | X', `X | 2'
and `1 | 2.' The first two settings cause entrance apertures 2 and 1,
respectively, to be blocked. The final setting, which corresponds to
both
entrance apertures being open, is used for almost all observing
applications.
- Laser:
Turns on the auxiliary laser, which is used to align the
interferometer optics.
When activated, this switch inserts a mirror
in the optical path which permits the auxiliary laser fringe pattern
to be viewed from the eyepiece on the north side of the FTS.
- Iris:
The two metal push buttons control the size of the
irises located in each entrance to the FTS at the focal plane of the
telescope. The aperture size is displayed on the meter
above the push buttons. The maximum setting is
24 arcsec and this is the standard observing configuration.
Smaller aperture sizes are useful for centering an object in the field
prior
to observation, but it is important to remember to open the aperture to
its full size before observing as the diaphragm is not cooled, and hence
is a
large source of thermal radiation.
- Beam splitter:
Displays the beam splitter currently in place. Note that
the beam splitter can only be changed from the Auxiliary Control Panel.
- Filter:
Selects the filter to be used for observations. The filter
number in place is displayed on the LED's to the left of the filter
selection wheel. Setting `0' is a blank filter position.
- Preamp gain:
Sets the preamp gain for the detectors. There are three
different settings, and it is important to select the gain which best
matches
the brightness of the source. Applying too much gain will cause the
signal to
be saturated while too little gain will introduce `digitization' noise.
The
following are rules of thumb for work in the 2
 region: Setting `1'
should be used for
 2, Setting `10' should be used for 2

 8,
and setting `100' should be used for all fainter sources. The amplitude
of the
observed data can be checked using the `digital voltmeter' (next
section),
or by displaying the `S1' and `S2' signals on the oscilloscope
(Section 3.1.4). The gain level can be fine tuned using
the dial located to the left of the `amplitude' and `offset' knobs of
the
divider section of the panel (Data Acquisition Control Panel).
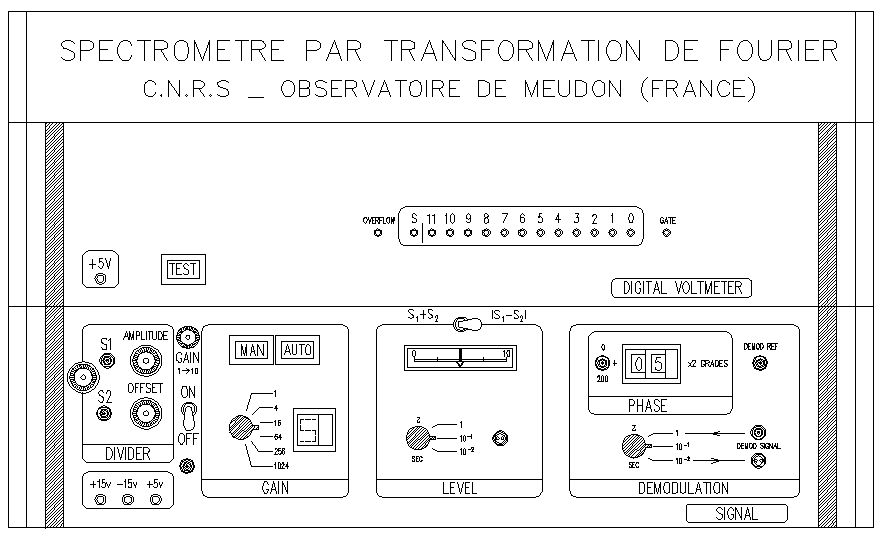
 The FTS signal control unit is shown in Figure 3.3.
- Divider: A basic assumption when recording an interferogram
is that the brightness of the source does not vary. This may not be the
case when sky transparency is variable due to clouds. Use of the divider
provides a means of correcting for variations in source brightness
by normalizing the detected signal with respect to the DC component.
However,
the divider is not a `catch-all' cure for cloudy nights, and care should
be
exercised in its use. In particular, the data quality should be
monitored
carefully when the sky conditions, and hence
extinction, are changing rapidly and by large
amounts. Under these conditions, the data quality across the scan will
not be
uniform, and noise will be introduced into the data. Moreover, the
divider
should not be used for faint sources; because of the low signal-to-noise
ratios
inherent for faint objects, the divider will rectify the output
according to
noise level, and not signal level.


There is a setup procedure which must be followed before the divider
is used. First, activate the divider circuitry using the `on/off'
switch.
Second, point the telescope at a blank region of
sky near the object to be observed, and adjust the `offset'
knob until the DC signal, displayed on the voltmeter beneath the switch
marked ` |
|  ' reads 0. Finally, center the telescope
on the source, and adjust the `amplitude' knob so that the mean
signal registers
  units on the same voltmeter. A data scan can then be
initiated. Monitor the signal level on the voltmeter for quality
control.
- Gain:
An interferogram contains data spanning a wide range of amplitudes;
the signal is very strong at ZPD, and very weak at large path
differences.
To optimize the dynamic range of the recorded signal, the gain used to
measure the signal coming from the detectors should vary according to
path difference. The way in which this gain correction
is applied is set by the software automatically. Data are always
recorded in autogain - the manual setting is for engineering purposes
only.
The LED next to this switch displays the gain setting. Additional
gain can be added using the knob marked `Gain
 ', located
near the upper left hand corner of the `gain' area.
- Level:
The voltmeter displays the signal level. The type of signal
to be displayed is selected with the switch above the meter. The switch
below
this meter sets the time constant for an output device. The most
interesting signal is
 which indicates the total signal received by the
detectors
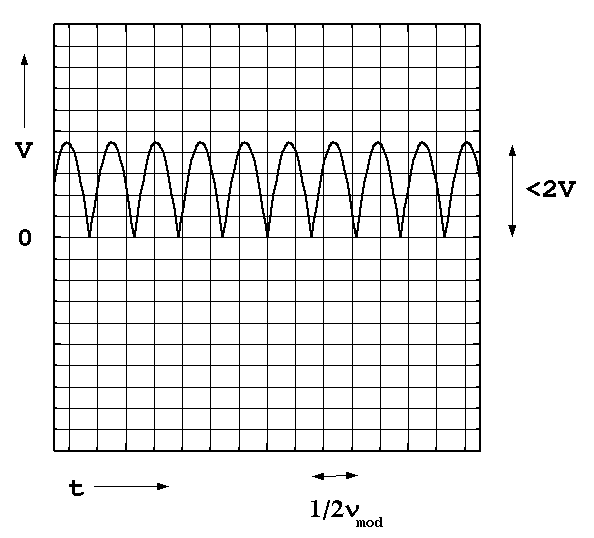
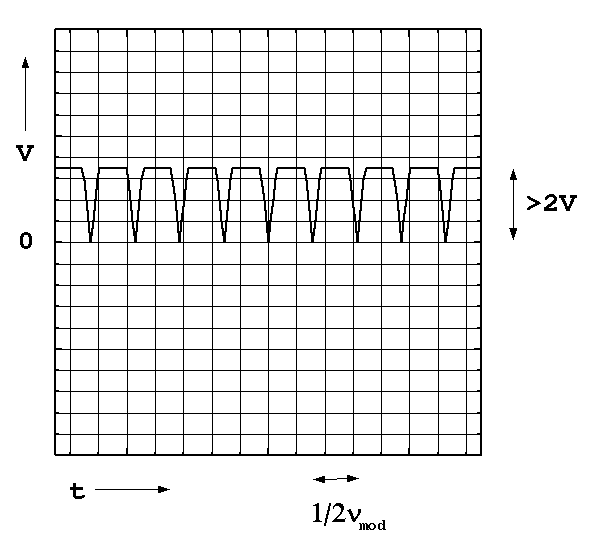
- Demodulation:
The phase of the demodulation signal, specified in
grads, can be selected using the dials marked `Phase'. The correct
phase setting can be determined at the beginning of the night
using a bright source. After positioning the carriage at optical
ZPD, and before positioning the carriage ahead of ZPD in preparation
for observing, display the demodulated signal on
the oscilloscope (Section 3.1.4). The correct phase is that which
produces a
continuous signal (i.e. no breaks are apparent on the oscilloscope
screen) as illustrated in Figure 3.4.


- Digital Voltmeter:
The voltmeter displays the data in bit form as it is
recorded. To prevent digitization noise, as many of the bits as
possible should be used, and this is controlled via the preamp
gain setting (Section 3.1.1).
 Figure 3.5 shows the FTS error signal and servo control panel. The relevant
settings and displays of this unit are detailed below.
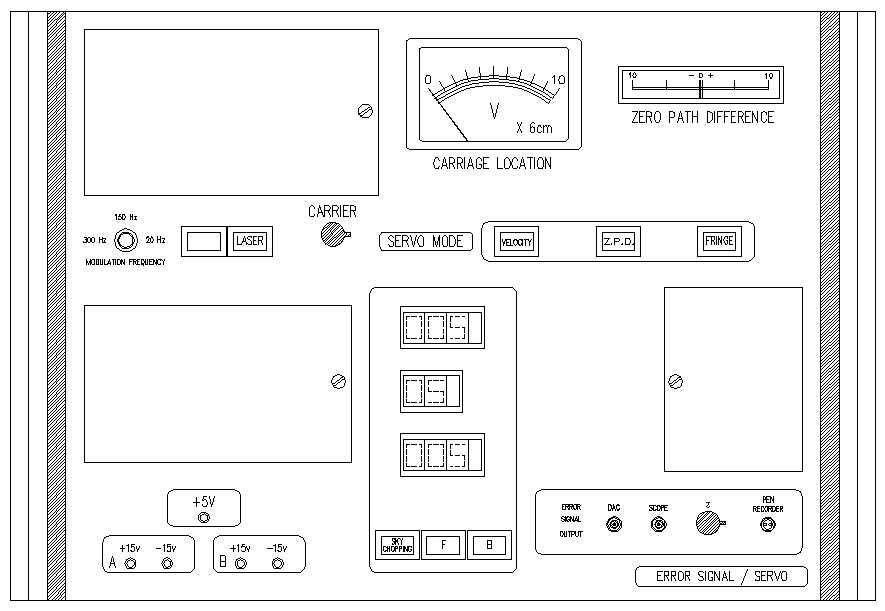


- PQT: The values for P, Q, and T, all of which are set by the software,
are displayed on the appropriate LED's.
P is the step size of the scan in terms of
 , Q is the amplitude of the internal modulation (Section 1.3), also in terms of
  , and T is the integration time in ms per step.
Note that a display of 0 in the
T LED corresponds to an actual integration time of 10 ms per step -
i.e. if the display reads 50 then the actual integration time per step
is 60 ms. The `sky chopping' light will
be illuminated by the software whenever the beam switching option is
requested
from the Section 5.2.1); the lights labelled `F' and
`B' monitor the direction of carriage motion (forward versus backward).
- Internal modulation frequency:
The optimum frequency for internal
modulation (Section 1.3) depends on the brightness of the source being observed. For
example, high frequency modulation is needed to suppress scintillation
noise in
very bright objects, whereas detector noise dominates for faint objects.
There
are three settings for the internal modulation frequency:
300 Hz (bright objects), 150 Hz (objects of intermediate brightness),
and 20 Hz (very faint objects). Long integration times (
 200
200 ) should
be used when the 20 Hz modulation frequency is selected.
- Carrier:
Adjusts the amplitude of the demodulation carrier signal. It is
important that this signal have a peak-to-peak value within
 V.
V.
- Servo Mode:
The servo system has three different operating modes,
only one of which is used for data acquisition.
When the interferometer is first activated, the servo system is in
velocity
mode. In this configuration, the
moveable carriage is free to drift, and the path difference can
be set manually using the two buttons above the velocity mode switch.
The position of the carriage can be monitored using the meter marked
`carriage location'.
ZPD mode is used to position the carriage near (but not at) optical ZPD.
Using error signals generated by a position potentiometer and a position
transducer, the carriage is
moved to the position of `mechanical' zero path difference. It is
important to note that this is not
the same as `optical' ZPD, which is found using a scanning
technique, with the servo system in `fringe' mode (see Section 4.4).
Once the carriage has been positioned at mechanical ZPD
(which occurs when the error signal displayed on the oscilloscope [Section 3.1.4]
has stabilized and the ZPD button is illuminated), then the servo system can be put into
`fringe' mode, which is the mode used for data acquisition.
In this mode, the interference fringes produced by the reference laser
are
used to monitor path difference (Section 2.2). The servo system is
activated in a four step process, which can be monitored from the R1/R2
oscilloscope (Section 3.1.4); if the servo system comes out of lock,
or fails to lock, an alarm will sound and the system returns to velocity
mode. The alarm can be turned off by putting
the servo system into ZPD mode.
 The FTS oscilloscope and error signal displays are illustrated in Figure
3.6. Various signals from each of these displays should be monitored
carefully while observing.
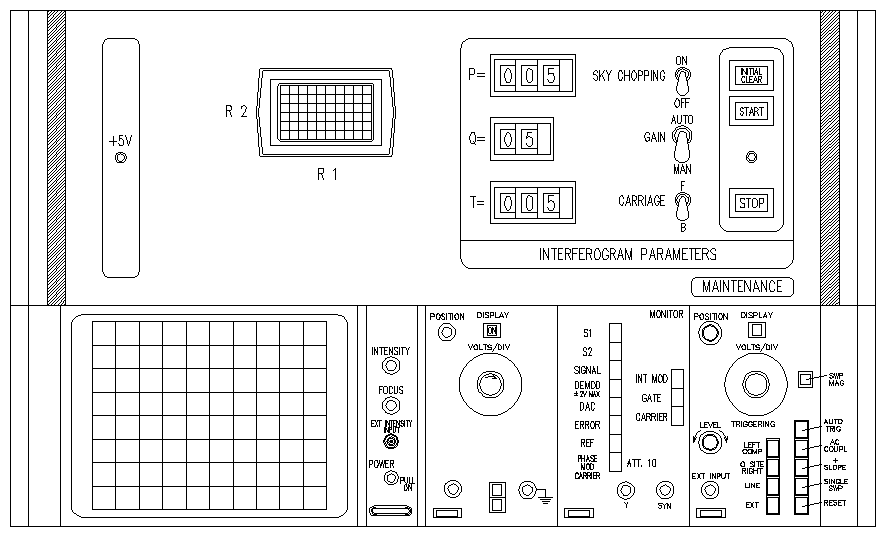


- The Oscilloscope: The oscilloscope allows many of the critical signals
produced by the interferometer electronics and the detectors to be
monitored.
The key signals to be monitored at various times during data acquisition
are:
- S1 and S2, the DC outputs from the two detectors. These signals are
useful
for centering the source in the aperture, and determining if the signal
is
saturated. Saturation corresponds to a voltage of about 10 V so from the discussion in section 1.2 these signals should NOT exceed 5 V when the FTS is not located at ZPD.
- DEMOD, the demodulated output signal (interferogram). This signal can be
used to set the phase of the demodulation reference signal, and can also
be
used to determine if the signal is saturated (in this case the signal
will
appear clipped as illustrated in Figure 3.7).


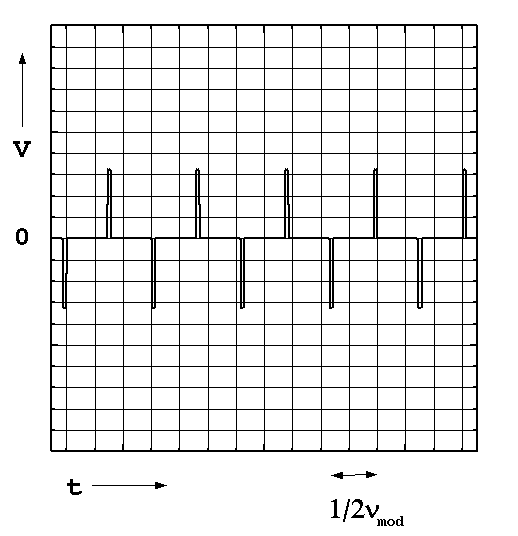
- ERROR, the servo system error signal. It is important to monitor this
signal as one enters ZPD mode and fringe mode to determine when, or if,
the
servo system has locked. The normal appearance of the error signal when
in fringe mode, but not scanning, is shown in Figure 3.8.


- The R1/R2 oscilloscope:
This oscilloscope monitors the
 and
and  signals
produced by the photodiodes in the interferometer (Section 2.2).
The oscilloscope has an independent power supply, and must be turned on
using
the on/off switch at the back of the oscilloscope. Under normal
operating
conditions this oscilloscope will display a Lissajous figure.
Any departure from an oval shape when entering fringe mode
indicates that the servo system is not locking. At the
beginning of the night, the Lissajous figure will vary in size until the
reference laser stabilizes (
 one half hour after the laser is turned
on).


The general layout of the master control panel is shown in Figure
3.1. The control panel can be subdivided into 4 areas, each of which has
a separate function. In the subsequent discussion, these areas will be
referred to as (1) instrument setup, (2) data acquisition control,
(3) servo control, and (4) instrument status. Detailed close-ups of each
area
are shown in Figures 3.2, 3.3, 3.5 and 3.6


The FTS optics control panel is illustrated in Figure 3.2 and its various
functions are described below.
The FTS signal control unit is shown in Figure 3.3.

|
' reads 0. Finally, center the telescope
on the source, and adjust the `amplitude' knob so that the mean
signal registers
units on the same voltmeter. A data scan can then be
initiated. Monitor the signal level on the voltmeter for quality
control.


The FTS oscilloscope and error signal displays are illustrated in Figure
3.6. Various signals from each of these displays should be monitored
carefully while observing.


