

 The menus discussed in this section are illustrated in Figures
5.2 to 5.7.
 The Scans menu (figure 5.3) is the basic menu for all data acquisition. Many of the
parameters in this menu are correlated; consequently, since changing one
parameter may affect other entries, the menu is
automatically updated to reflect these changes.
For example, if the step size P is changed, then the `resolution' entry
will change automatically to accommodate the new value of P. Before
starting a scan, check that the automatically selected parameters are
the ones you actually want. Also make sure that the correct filter has
been selected: the current filter wavenumber boundaries are indicated at
the top of the Scans form.
The following parameters can be set or entered in the Scans menu:
- Gain Mode:
This switch toggles between automatic and manual gain
settings for the signal read from the detectors (not to be confused with
preamp gain, which is set on the master control panel). `Automatic' is
the
normal mode for data acquisition and, as the name implies, the gain
setting is
automatically adjusted to match the dynamic range of the recorded data.
- T:
The integration time in ms at each path difference. Changing this
parameter will cause the scan time and total observing time entries near
the
bottom of the menu to be updated.


- P:
The step size of the scan, in terms of
 . An optimum value for the step size, the maximum that prevents
aliasing, is given, and is
automatically computed from the relation

where the lower and upper passband boundaries of the selected filter (in
 ), plus some extra range on each side of the filter, are given by
 and
and  respectively. As a result,
Changing P will cause the resolution
entry on the menu to be updated. P values lower than the optimal value
(corresponding to a broader FSR, discussed below) can be used and can be
useful, as an example, for low resolution work with a narrow band
filter. However, the FSR must always include the filter boundaries, so
some values of P will not be accepted.
- FSR Limits:
These entries are display only, and provide the limits of the Free Spectral Range, which is computed based on the current value
of P. The spectrum will be computed between these two limits.
- Q:
The internal modulation amplitude (Section 1.3), in terms of
 . An optimum value, based on the central
wavelength of the filter and 1.21, is displayed next to the Q entry.
- Wave Number:
This entry is display only, and gives the wave
number corresponding to the optimum modulation for Q. This wavenumber
must be within the filter boundaries. The closest wavenumber to the
middle of the filter bandpass is used as the criterion to select Q.
- Steps:
The number of steps in each scan. Since the number of steps effects the
total path length of the scan, changing this entry will cause
the resolution, scan time, and total observing time entries to be
updated.
- Res:
The spectral resolution, in
 . This is defined as
the location of the first zero crossing in the sinc function defined by
the path difference (see Section 1.2). As of this writing, this value is
for display only and can not be entered interactively.
- Scans:
The total number of scans. Typically, scans are obtained in
pairs, so that the carriage is returned to its initial starting position
in preparation for subsequent data acquisition.
(Executing one scan will move the carriage in only one direction.)
- Direction:
The direction of the first scan. In almost all applications
this should be set to `forward'.
- Beam switching:
This switch activates beam switching mode, which is used
whenever accurate background subtraction is required. Beam switching
should be used when the sky background is very large. This
flag is `sticky' - once set it will stay on until manually reset.
- Symmetric Mode:
For most applications, the carriage is positioned
180 steps to one side of ZPD prior to obtaining data, and this portion
of the scan is discarded during the initial data processing.
However, for very faint sources, where
observing time is critical and high resolution data cannot be obtained,
this
procedure could result in significant time loss. Symmetric mode was
designed to optimize observing time on faint objects.
In this mode, the carriage is positioned at maximum path
difference at one end of the scan. During data acquisition, the carriage
travels
through ZPD to maximum path difference on the other side of ZPD. In this
way,
data on both sides of ZPD can be used.
- Move Carriage ahead of ZPD:
After positioning the carriage at optical
ZPD using the ZPD task (see below), the carriage is normally moved
180 steps to one side of ZPD. (The exception is symmetric mode, where
the carriage is placed the maximum path difference on one side of
ZPD - see above.) Positioning the carriage in this manner
ensures that all the high amplitude fringes on each side of ZPD are
recorded
during each scan. This information is required by the reduction software
to
locate the exact location of optical ZPD. As long as the carriage
is returned to its initial starting position after each set of scans,
then it should not be necessary to use this command unless the carriage
has
been repositioned at ZPD using the ZPD task. Consequently, the flag is
not `sticky' - the `move carriage' flag is automatically reset by the
software to its default `off' position after each execution.
- Show Interferogram:
If this option is selected, each block of the raw
interferogram is displayed on the screen as the data is acquired. For a
more detailed description see Section 5.3.1.
- Show Spectra:
If this option is selected, a power spectrum of the
interferogram is displayed as data is obtained. The spectral resolution
will increase as the path difference increases to larger values. For a
more detailed description see Section 5.3.1.
- Coadd Spectra:
For high resolution work, or observations of faint
objects, it may be desirable to display coadded spectra.
- Scan Time:
This entry is for display only, and shows the observation time
per scan in the format hh:mm:ss.s.
- Total Observing Time:
This entry is for display only, and is the product of
the scan time and the number of scans. Again, the format of the display
is hh:mm:ss.s.
- Object:
The name of the object being observed. This entry, as well
as those for Observer and Comments described below, is `sticky',
and will not change unless entered by the observer. N.B.: it is
recommended that this entry
NOT contain the special characters ", ', or #
as these have the potential to cause a crash of the Pegasus session
manager.
- Observer:
The name(s) of the observer(s).
- Comments:
Any last words for posterity before you start a scan?
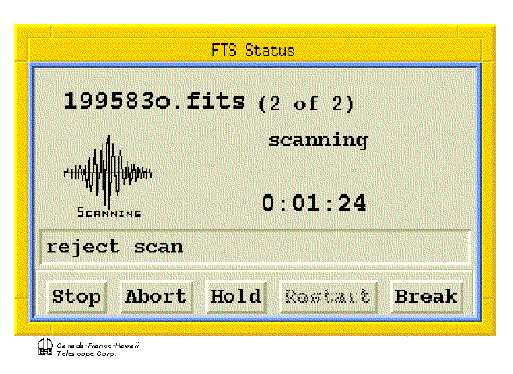
An exposure will start once the scan menu is accepted. An FTS Status
icon similar to that shown in Figure 5.4 will
appear in the upper right hand corner of the workstation screen, which
contains the exposure number (see Section 5.3.3),
as well as the time left before the scan is completed. The five buttons
at the bottom of the status icon have the following actions:
- Stop: selecting this button will stop a scan immediately and save the
data
acquired for that scan up to that point on disk. If you stop while
taking a sequence of scans the remainder of the sequence is terminated.
- Abort: this option will
terminate the current scan and not write data to disk. As a consequence,
the data is lost. If you abort while taking a sequence of scans the
remainder of the sequence is terminated.
- Hold: choose this option if you want to temporarily halt an exposure.
- Restart: if you are holding an exposure, select this option to resume
scanning.
- Break: this selection will break a sequence of scans. The scan currently
being taken will be completed but the rest of the sequence will be
terminated.
A confirmation message
will appear if any of these options is selected.


Before starting a scan it is necessary to first position the carriage
at optical ZPD, which is the path difference which gives the maximum
fringe
amplitude. The ZPD task automatically scans a portion of the carriage
where
this is known to occur (it is assumed that the carriage has already been
set
to the mechanical ZPD position, and the servo system is in fringe mode).
The search for ZPD is done in two stages, the first being a crude scan
with
large step sizes (P  24), the second using P = 2.


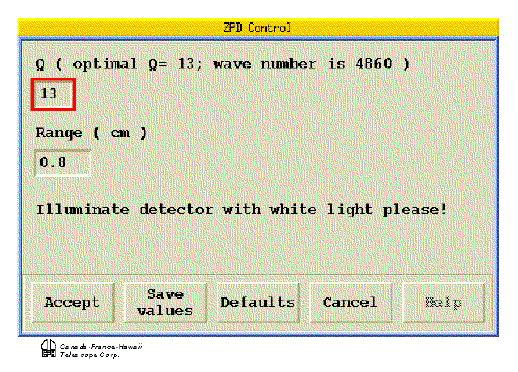
There are two entries on the ZPD menu (Figure 5.5):
- Q:
The amplitude of internal modulation, in terms of
 of the reference laser, appropriate for the filter. The optimum value is
displayed above this entry.
- Range:
The range to be scanned, in
 . Usually, this should be
set to 0.8.
The above two values are automatically set and hence should not have to
be changed or entered. Use of this command does, however, suppose that
light is falling on the detectors through a selected filter. Once the
ZPD menu is accepted, a series of scans will start to
zero in on ZPD. During this procedure, an exposure icon will appear in
the
lower left hand corner of the workstation. As with regular exposures,
the ZPD
process can be stopped or aborted, using the procedure discussed in
Section 5.2.1.
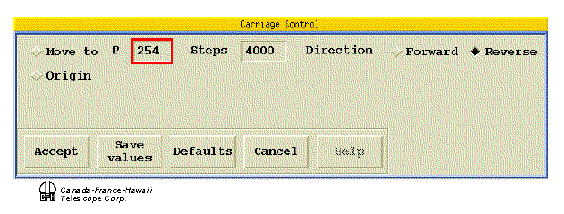
In certain circumstances, an observer may want
to manually move the carriage. There are
two possible manual motions that can be specified in the Carriage menu
(Figure 5.6):
- Move:
When flagged, this entry causes the carriage to be moved a distance
specified by the P and Steps entries. The direction of carriage motion
(Forward or Reverse)
must also be specified.
- Origin:
Causes the carriage to return to the point of origin (i.e. the
carriage position before the preceding scan was started). This
repositioning
has been found not to work very well for scans involving small path
differences.


The most common use of manual carriage movement is to avoid repeatedly
looking for ZPD when you are making successive pairs of scans on an
object with more than one filter (provided that the change of filters
does not necessitate a change of beam splitters). After the first pair
of scans has been completed you can select the Carriage menu, change the
entry for P to the value that was used for the previous scan, set Steps
to 180, and select the Forward direction. Flagging the Move option and
clicking on Accept will then move the carriage back to ZPD. A new filter
can then be inserted into the beam and a new scan started from the Scans
form. Another application is to setup for symmetric
observing mode (see Section 5.2.1).
Manual carriage control is also often useful for engineering purposes.
This menu (shown in Figure 5.7) provides a quick way of setting the values
of T, P, and Q
found in the Scans menu, but without having to start an actual scan.
The entries are filled out the same as in the Scans menu. See Section 5.2.1 for a discussion of the significance of these three important parameters.


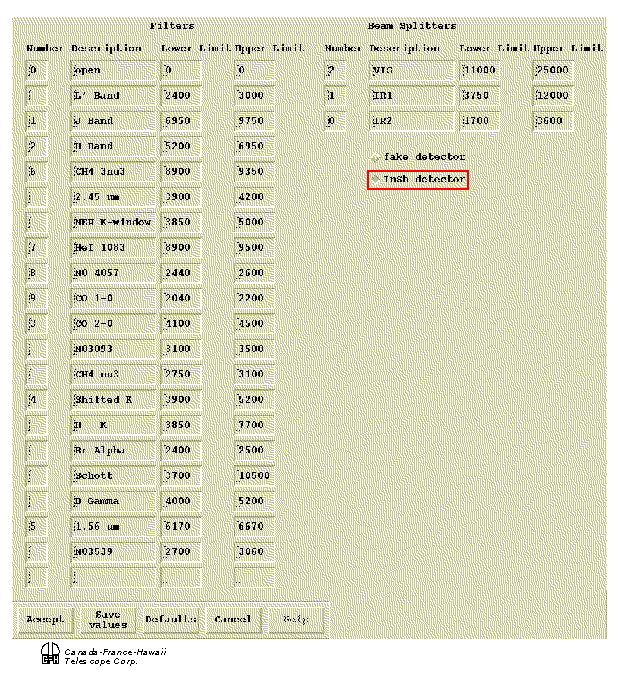
The filter table tells the computer which filters are installed in the
FTS dewars. It is filled out during the instrument setup, and is only
changed
when the filter configuration is altered. There is not an icon
to access the filter table; rather, it can be displayed using the
following
procedure. First, move the cursor into a blank part of the screen and
hold
down the right hand button of the mouse. A menu will appear.
While continuing to hold down the
right hand button of the mouse, scroll down the menu to the `Session
Setup' entry. Release the right hand button of the mouse, and then
depress it
again. A second menu will appear. While continuing
to hold down the right hand button of the mouse, scroll down this menu
to the
`Select Detector' entry. Release the mouse button and a filter table
similar to that shown in Figure 5.8 will
appear.


The filter table contains the following information: the positions
occupied by the various filters in the filter wheel (values 1 through 9;
position 0 is always open); the name of
the filter; and the approximate upper and lower boundaries of the filter
response, in  . Information for the three beam splitters is also
displayed.


The menus discussed in this section are illustrated in Figures
5.2 to 5.7.
The Scans menu (figure 5.3) is the basic menu for all data acquisition. Many of the
parameters in this menu are correlated; consequently, since changing one
parameter may affect other entries, the menu is
automatically updated to reflect these changes.
For example, if the step size P is changed, then the `resolution' entry
will change automatically to accommodate the new value of P. Before
starting a scan, check that the automatically selected parameters are
the ones you actually want. Also make sure that the correct filter has
been selected: the current filter wavenumber boundaries are indicated at
the top of the Scans form.

), plus some extra range on each side of the filter, are given by
and
respectively. As a result,
Changing P will cause the resolution
entry on the menu to be updated. P values lower than the optimal value
(corresponding to a broader FSR, discussed below) can be used and can be
useful, as an example, for low resolution work with a narrow band
filter. However, the FSR must always include the filter boundaries, so
some values of P will not be accepted.

24), the second using P = 2.


. Information for the three beam splitters is also
displayed.


