 Canada-France-Hawaii Telescope
 Canada-France-Hawaii Telescope
 5 Setup and Checklist
The section 5.1 aims at providing the user with basic notions of Fabry-Perot interferometry and how it is used in astronomy. The sections 5.2 and 5.3 are more specific instructions on how to set up the MOS/FP or SIS/FP at CFH. The tasks described in these sections are usually performed by CFHT staff but it is certainly useful to the observer to be aware of them.
The Fabry-Perot is an interferometer composed of 2 semi-reflective mirrors. When the spacing between the mirrors is an integral number of wavelength, light is transmitted. When it is half an integer number of wavelength, destructive interference makes that the transmitted intensity is very low. The contrast between the maximum and minimum transmitted intensity depends on the reflectivity of the mirrors. The resolution and free spectral range (distance in angstrom between two interference orders) depends on both the spacing between the mirrors and the finesse.
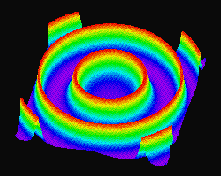
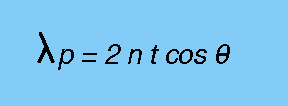
The phase difference can be produced in three different way: changing the physical spacing between the mirrors, the refraction index or the incidence angle. This path difference can be visualized in the following figure. This is expressed mathematically by the basic Fabry-Perot equation:

where theta is the incidence angle of the light, lambda the wavelength, n the refraction index, and t the distance between the mirrors. It is easy to understand that given the symmetry of revolution of the Fabry-Perot etalon, a constructive interference for a given angle theta, results in a ring of light (assuming the Fabry-Perot is illuminated by an extended monochromatic source). Therefore, the multiple ring pattern typical of Fabry-Perot interferometers. Here the phase change is produced by the various incidence angles. A phase difference will also be produced by a change in spacing. For a given interference order (given ring) a change in spacing produces a change in angular extend of the ring since the product interference order by wavelength is constant. Therefore, the increase in ring diameter as the spacing is increased. The following figure illustrates this basic behavior and other properties of the Fabry-Perot. The links formulae#1 and formulae#2 contain several simple but useful relations about Fabry-Perot etalons.
In order to understand how spectra can be obtained with MOS/FP, we start with the following simplification. Consider only the Fabry-Perot on-axis. Ignore the phase change caused by angle. Let's change the optical path by changing the physical spacing between the Fabry-Perot mirrors. The etalon acts like a tunable interference filter, scanning in various steps the wavelength range selected by the pre-monochromator. Such an instrument (with a very small field of view, on-axis and a single pixel detector) allows to obtain a spectrum of the target pointed. Spatial information is limited to a small aperture on the target, and a wavelength range equal to or less than the etalon free spectral range is scanned. The way the Fabry-Perot is used in an instrument like MOS/FP or SIS/FP, is similar except that now a large field of view is accessible and multiple spatial information is available (field sampled by multiple pixels). The image of the object (galaxy or nebula) is modulated by the ring pattern of the interferometer. One can consider every pixel of the image like the single pixel instrument (or spectrophotometer) described earlier. Each pixel on the detector provides a spectrum at various positions on the science target, each spectrum covering the etalon free spectral range or less. Only, the wavelength zero-point of the first channel or interferogram scanned, is dependant on the position in the field. To cancel the wavelength variation across the field, in other words to transform the "m" interferograms into "m" monochromatic images, one performs the phase map correction. This consists in translating each line profile obtained from a cut along the channels for a given pixel on the detector, or position on the object. The phase map is obtained by scanning a calibration source, and indicates the amount of translation needed for each position.
The Queensgate Fabry-Perot Controller and etalons are extremely reliable components, which have seldom caused trouble. However, they are aging (controller and etalon CFHT#1 were bought at the beginning of the 1980's). They have been sent back to Queensgate on a regular basis for minor repairs or upgrades. To summarize briefly the functionning of the Queensgate etalon we will only say that a servo-mechanism insures the stability of the parallelism and allow variable spacings to be applied. It uses piezo stacks as actuators, and pair of metal pads evaporated on the circumference of the plates acting as capacitors. They are the "encoders" in the sense that a change in distance between the pads produces a change in capacitance which is detected by the controller.
This setup is performed by CFHT staff. Once the Fabry-Perot and controller
(CS100) are installed, connected and powered on, adjust the settings for the
particular etalon. The settings are listed in the following table.
The following illustration shows the
front panel of the Fabry-Perot controller, the CS100.
There are nine buttons on the left-hand side of the CS100, from left to
right, the fine, coarse, and Resistive components adjustment. X, Y, Z go from
top to bottom. These must be set specifically for each etalon, before to
switch the CS100 on. The gain and timeconstant (below the viewmeters) should
be set at G=64 and T=25. Switch on the CS100. If the led indicating close
loop is off, flip the switch to close the loop. If the switch is flipped
already, push down the reset switch (these switches are located on the
right-hand side of the CS100 and are clearly labeled). If you don't know the settings for a given etalon or if you can't close
the loop, follow this procedure (from QUEENSGATE INSTRUMENT LTD, CS100
instruction manual, p.2.8).
Each etalon has an optimized gain and timeconstant value. After this
procedure one must still adjust the parallelism of the etalon. Use the Neon
portable calibration source to align the etalon. Both etalon and CS100 should
be cold. The following figure illustrates
the geometry of the Queensgate etalons. Note the orientation of the
connectors notch and X and Y axis. These will be useful when you attempt
adjusting the etalon parallelism. During this procedure, be careful not to induce condensation on the
Fabry-Perot with your breath. Use a mouth mask if you can (or hold your
breath!). You can either have the etalon mounted on the swing arm and out of
the FP module or the etalon on its mounting ring, not yet attached to the
swing arm. The latter is more practical. Look at the Neon lamp through the
etalon. Swing your head back and forth along the X axis, and then along the Y
axis. If the rings diameter change, the etalon is not parallel. Adjust the X
and Y settings on the CS100 to have no change as you move your head. A change
in ring diameter will be more easily seen if you adjust the etalon spacing
(Z) so that the central ring is very small. The following procedures should be carried out on the Pegasus session,
after the instrument has been set up and the etalon ajusted. This task is
performed by CFHT staff before the instrument is handed to the visiting
astronomer. However, if a visiting astronomer feels that this parameter could
be better defined or simply wishes to verify the setting he or she is welcome
to carry out the procedure himself or herself. Important Notice: At the time of this writing a procedure is being
developed for the FOCAM/FP AOB mode in order to determine the free spectral
range BCV interval and the finesse. Since, when used with the AOB the angular
field is extremely small, it is difficult to see a single ring. This makes
the following procedure obsolete. Therefore, another procedure has been
established. It uses the "CALIBRATE"
button on the pegasus menubar. Once completed it is strongly advised that you
used this procedure instead of the one described below. The window requires a
exposure time per interferogram and a number of channel. What this procedure
does is obtain a scan for the whole BCV range of the CS100, in the center of
the Fabry-Perot ring pattern. More than one peak will be seen (approximately
1.7 order is scanned at Halpha with the etalon CFH#1). If not, change the Z
voltage setting on the CS100. From the scan it is easy to determine the BCV
spacing between the two interference order (peaks) and also the finesse of
the etalon (BCV range between orders divided by width of one peak). The way
it is actually done at the Pegasus session is the following. After the scan is completed a supermongo window is displayed Note that the value is also automatically written in the "Fabry-Perot" form
Check with the Software group to know the status of this procedure
(J. Thomas; July 1997). Calculation of the etalon finesse: The number of channels that the
observer should scan is 2.2 times the finesse. Therefore, it is important to
have an accurate measurement of the finesse in order to have an adequate
sampling of the spectral profile. Using the manual scanning option, set the ring pattern so that you have a
small, well defined, central ring (the intensity at the center should be the
same as the inter-order level). Measure with the Grapher function
"area-statistics" the centroid and FWHM of the 2 peaks across a central cut
through the ring. What you see on the grapher will be a plot similar to
this one. The finesse is given by:
Calculation of the etalon Constant: The etalon scanning constant is
the pseudo-expansion of the piezo-stacks (in Angstrom) for 1 BCV (Binary
Control Value) step applied to the etalon. It is used to determine the range
or steps of BCV that must be scanned by the etalon in order to cover a given
wavelength range. If DELTA(BCV) is the BCV range needed to scan a whole order
at a given wavelength, then the scanning constanc C is given by: It must be carefully measured. The value of this parameter is similar
from etalons to etalons, ranging between 2 and 3 (2.7 on average; it is a
physical characteristic of the piezo material). Use 2.7 for a start. You can
gain time if you proceed as follow (the alternative is trial and error!).
Set the BCV in order to have a complete ring. Let's call this ring the
interference order n. Measure the ring radius (cut across the center of the
ring). You must then apply a BCV difference so that the ring corresponding to
the interference order n+1 has a radius approximately equal to the ring n
that you started with. Measure the ring radius again. You can then enter your
measurements in the formula below. Be careful with the signs: if the ring n+1
is smaller DELTA(R) is negative. The difference in delta(BCV) can also be
negative. Remember to enter the Radius, not the diameter. If the radius of the ring (order n+1) is smaller than the previous ring
(order n), the DELTA(R) is negative and delta(BCV) positive. The accurate
scanning constant of the etalon is given by:
SUMMARY CHECKLIST
		CFHT #1				CFHT #3
		p=1162				p=80

	fine	coarse	R Balance	fine	coarse	R Balance
X	2.48	0.2	0.46		5.28	0.3	4.08
Y	6.60	0.2	4.06		0.28	0.0	3.85
Z	5.22	0	4.12		2.75	-1.0	4.11

(interference orders defined for Halpha at 6563.75 A).
5.3 On the Pegasus Session


Return to the Table of Contents