[Contents]
[Prev]
OSIS Performance
Imaging
The overall efficiencies of OSIS and MOS, in terms of optical
throughput, are comparable.
The sensitivity of OSIS was measured on M92 andNGC7006 standard star
fields (Christian et al., 1985, P.A.S.P., 97, 363) observed
under photometric conditions with the Lick2 CCD. We found the
following transformation equations:
V = 25.11 - 0.1 - 0.089(V - R) - 2.5 log(counts}(e/sec))
R = 25.36 - 0.08 + 0.054(V - R) - 2.5 log(counts)(e/sec))
( being the airmass).
The same relations are valid for the Loral3 CCD; with the new thinned
CCDs, a gain ~ 2 in sensitivity is expected in V and R (and even more
in blue), i.e. the zero points in magnitudes should be increased by
roughly 0.75.
Bonnette guiding
Even in bonnette guiding mode, the better sampling and better
uniformity of the PSF across the field makes OSIS a better choice than
MOS for direct imaging, as long as you do not need a large
field. But the sensitivity of the APD sensors makes it
feasible to use active guiding in almost any field (see chapter 3 for
a discussion).
Active guiding
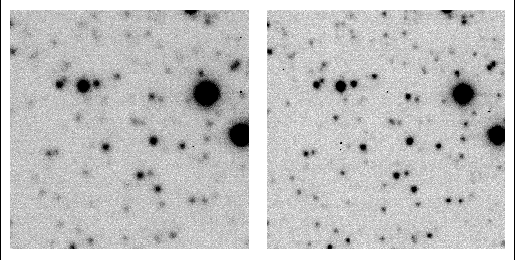
The SIS active guiding loop has been demonstrated to improve the
image quality of objects as measured on the CCD focal plane. For
instance, a series of images of M92 were taken with the active
guiding loop successively turned on and off. Un-stabilzed images were
measured with a mean FWHM = 0.9" while images stabilized with the
active guiding had a mean image quality improved to FWHM = 0.73".
FIGURE 26. OSIS images taken without the active guiding loop
(left, FWHM = 0.9")
and with the guiding loop on (right, FWHM =
0.73"; the fast guiding frequency was set at 50 Hz).

Spectroscopy
The efficiency of SIS in spectroscopic mode has been measured on
standard spectrophotometric stars (Oke J., 1974, Ap.J. Suppl.,
27, 21; Stone R., 1977, Ap.J., 218,
767). The combined efficiency (atmosphere + telescope + SIS +
grism(O300) + CCD(Lick2)) is about 11% at 5500 Å.
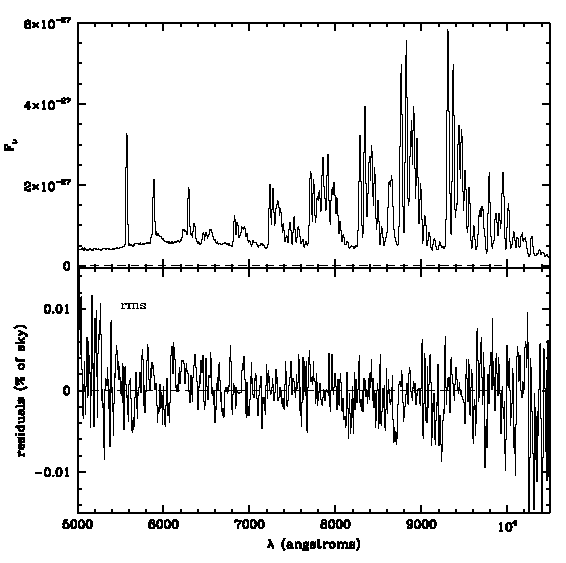
Figure 27 shows a typical sky spectrum obtained with the R300 grism
and a slit 2" wide. The accuracy of the sky correction is on the order
0.2% r.m.s. of the sky intensity.
FIGURE 27. (top) Sky spectrum with R300; (bottom) residual of the
sky correction (task background in IRAF, third order Chebyshev
polynome), expressed as a percentage of the sky intensity. The r.m.s
of the residuals are 0.2% in the interval 6000 -- 9000 A, higher at
the edges because of lower grism efficiency.

[Contents]
[Prev]
Send comments to: eugene@cfht.hawaii.edu
Copyright © 1997, CFHT Corporation. All rights reserved.
 - 0.089(V - R) - 2.5 log(counts}(e/sec))
 - 0.089(V - R) - 2.5 log(counts}(e/sec))
 + 0.054(V - R) - 2.5 log(counts)(e/sec))
 being the airmass).

