f/19.6, giving a scale of
342 µm/arcsec (2.92 arcsec/mm). The minification of the
spectrograph is wavelength dependent, but it is about 0.17 in the
dispersion direction at the center of an order. In the direction
perpendicular to the dispersion, the minification is 0.209. In other
words, 1 arcsec on the sky corresponds to 71 µm. The spatial
resolution on the sky is limited by the natural astigmatism of the
optical system to no better than 0.5 arcsec.
CAFE
CAFE is used with a Bowen-Wallraven image slicer, all made of
silica. The fiber-microlens system forms at the microlens focus a
gaussian-shaped image that includes more than 95% of the signal inside a
800 µm diameter. This image is then reshaped by the slicer into an
elongated image 200 µm wide and 3.2 mm long. Placed at the Gecko
collimator focus, this four-slice image become the entrance slit for the
spectrograph and produces the required f/20 beam. |
 |
2. Order Sorting
Filters
Since this spectrograph has been designed to observe only a single
order at a time, there are two methods to isolate a single order from
the echelle mosaic. The first involves the use of order sorting
[interference] filters, particularly for the red orders. Prospective
observers can inspect a subset of the
CFHT Interference Filter
Database to decide on filters needed for their run. The following
table gives a list of filters that have been used successfully as order
sorters for the free spectral ranges of the orders defined below.
Wavelength
(Å) |
Order |
CFHT
Filter # |
Peak
Efficiency (%) |
Approximate
Coverage (Å) |
|---|
| 5170 | 11 | #1508 | 80 | 5150-5250 |
| 5876 | 9 | #1519 | 89 | 5600-6200 |
| 6140 | 9 | #1519 | 89 | 5600-6200 |
| 6428 | 9 | #1617 | 86 | 6200-6800 |
| 6710 | 8 | #1626 | 92 | 6520-7040 |
| 7699 | 7 | #1704 | 89 | 7680-7855 |
| 7773 | 7 | #1704 | 89 | 7680-7855 |
| 8480 | 7 | #1803 | 93 | 7900-8780 |
| 8542 | 6 | #1803 | 93 | 7900-8780 |
| 8700 | 6 | #1814 | 84 | 8660-8840 |
| 9086 | 6 | #1901 | 66 | 9035-10025 |
3. Order Sorting Grisms

Because the free spectral ranges of the echelle's orders become
relatively narrow in the UV-blue, grisms provide the most efficient
means of isolating individual orders for those blue wavelengths. The
following table gives the general properties of the three grisms
available.
Grism
Name |
Ruling
(g/mm) |
Blaze
(Å) |
Peak
Efficiency (%) |
Wavelength
Coverage (Å) |
|---|
| UV | 300 | 3500 | 75 | 3000-5000 |
| Blue | 150 | 6000 | 78 | 4000-9000 |
| Red | 100 | 9000 | 65 | 6000-10000 |
4. Collimator 
A spherical collimator mirror sends a parallel beam 318mm wide to the
grating. Two collimators are available: the first has an enhanced silver
coating for use from about 3800Å through the near-IR; the second
has an aluminum coating for use from 3000 to 4000Å. Changes
of the collimator (and camera) mirrors are only performed by CFHT
staff during the daytime when a new configuration is needed.
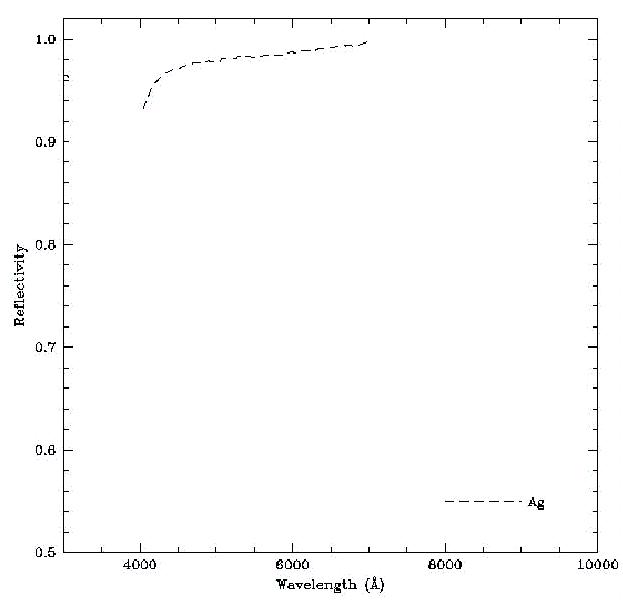
The following figure shows the reflective properties of the Ag + MgF2
coating (Gecko RED). The reflectivity is higher than 93% between 4000
and 7000Å, and above 98% above 6000Å.
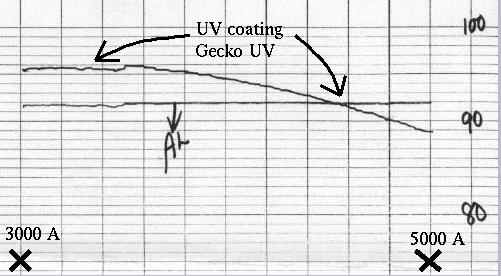
The following figure shows the reflective properties of the UV
enhanced aluminum coating (Gecko UV) shown along with a regular Al
coating, between 3000 and 5000Å. The UV coating gives a few
percent more reflectivity below 4500Å than a regular Al
coating. The reflectivity is still good up to and beyond 5000Å
(above 85%).
5. Hartmann Mask
A Hartmann mask is used for precise focusing of the spectrograph. The
Hartmann Masks are automatically opened and closed when the Focus Tool
is used. A good focus sequence (with 1+3 open, and 2+4 open) shows a
difference of centroids smaller than 0.1 px, and a FWHM of about 2.8 px
at the center of the detector (lines are thinner at the blue end of the
spectrum, and fatter at the red end - note also that lines may be very
large if a very wide slit is used). To speed up things, use a smaller
raster. If you want to do the focus with the lamp, turn the lamp ON (not
in AUTO mode), otherwise, it will not go on when the focus tool is
started.
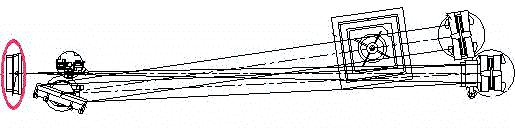
6. The 316 l/mm Echellette
Mosaic Grating 
For high spectral resolving power a mosaic of four 316g/mm echelles
is used, each having a ruled area of 154 X 320 square mm. The
approximate relationship between wavelength (in Å) and the grating
incidence angle (in degrees) for the 316g/mm grating in order k is:

The grating rotation and, hence, the central wavelength, is set
using a rotation table that supports the mosaic cell.
The procedure followed to align the four grating in the mosaic can
be performed only by CFHT staff. Guest observers must ensure that their
support astronomer is aware of every wavelength they plan to observe in
order that the spectrograph setup can be optimized for these settings.
The following table gives the approximate central wavelength, linear
dispersion and spectral coverage for each order between 3000Å and
10,000Å.
| Order | Central
Wavelength (Å) |
Dispersion
(Å/mm) | Coverage
4600 13.5
µm
pixels |
|---|
| 6 | 9429 | 2.43 | 150.9 |
| 7 | 8082 | 2.08 | 129.2 |
| 8 | 7072 | 1.82 | 113.0 |
| 9 | 6286 | 1.62 | 100.6 |
| 10 | 5657 | 1.46 | 90.7 |
| 11 | 5143 | 1.32 | 82.0 |
| 12 | 4714 | 1.21 | 75.1 |
| 13 | 4352 | 1.12 | 69.6 |
| 14 | 4041 | 1.04 | 64.6 |
| 15 | 3771 | 0.97 | 60.2 |
| 16 | 3536 | 0.91 | 56.5 |
| 17 | 3328 | 0.86 | 53.4 |
| 18 | 3143 | 0.81 | 50.3 |
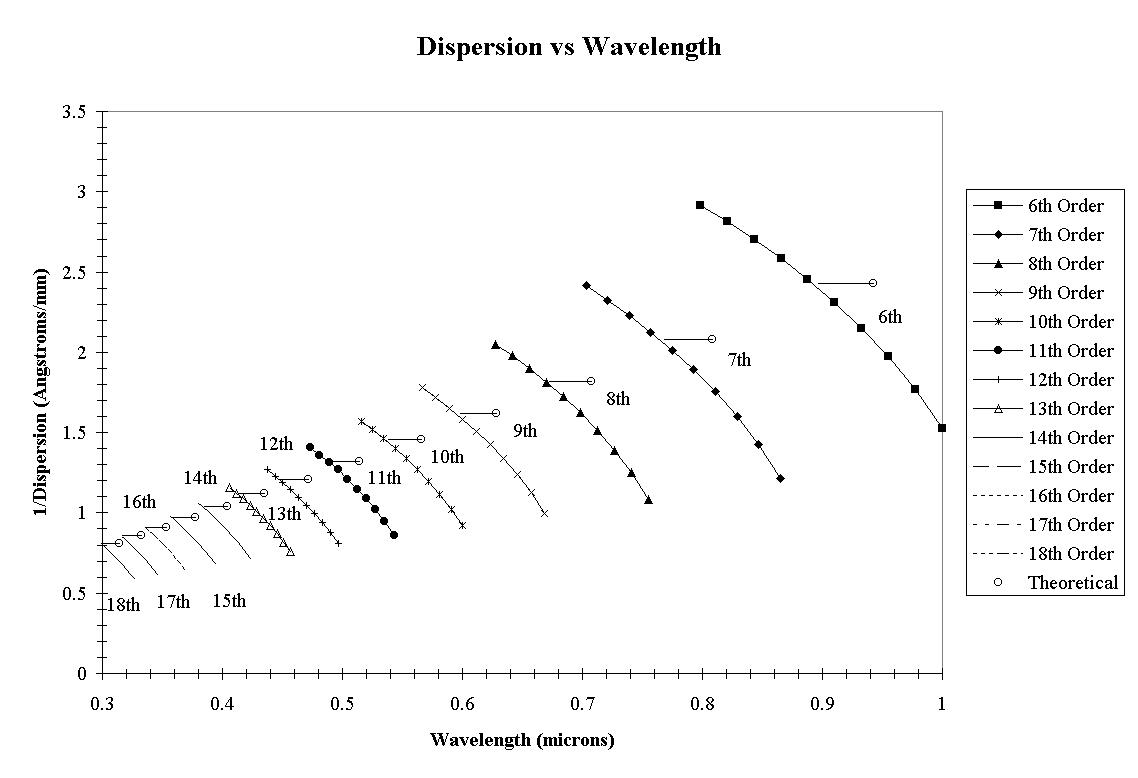
| The data given in the preceding stable are approximate because of
the changing dispersion within each order. Thus, relatively small
changes in the grating rotation within the same order may cause
noticeable changes in the linear dispersion scale. This is illustrated
in the accompanying figure for the whole wavelength range of the Gecko
spectrograph. |
 |
 |
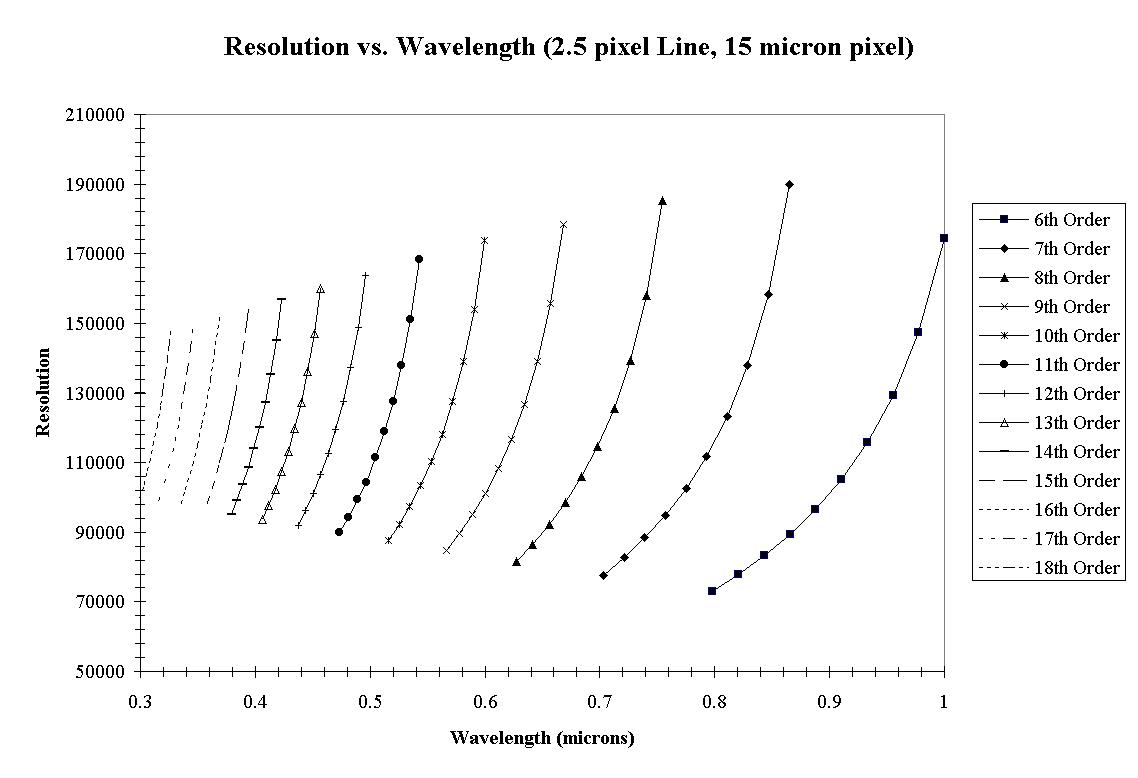
The corresponding changes in resolution (assumed equal to
2.5 pixels) are shown on the accompanying figure. These changes are
relatively large within each order, ranging between R=90,000 and
R=150,000. Therefore, the popular number for Gecko's resolution of 120,000
must be taken only as a rough estimate and not the actual number. [A
Better Figure Will be Added] |
The theoretical responses of the echelle are shown in the next
figure, below.

7. The f/4 Camera and
Detector Environment
The 600mm diameter camera mirror gives an unvignetted field of about
60mm in the camera focal plane. There are two camera mirrors, each with
a radius of curvature of 2500mm. One has a silver coating with a
protective overcoating of MgF2 (Gecko RED), for use from about
3800Å through the near-IR; the other has a UV enhanced aluminum
coating (Gecko UV) from Denton Vacuum for use from 3000 to
4000Å. Changes of the camera (and collimator) mirrors are only
performed by CFHT staff during the daytime when a new configuration is
needed.
The following figure shows the reflective properties of the Ag + MgF2
coating (Gecko RED). The reflectivity is higher than 96% between 4000
and 7000Å.

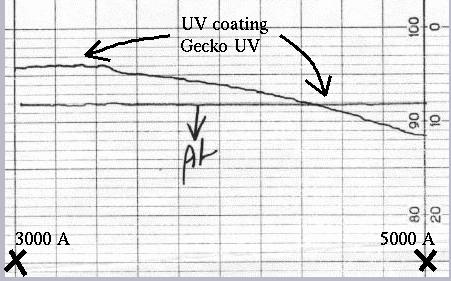
The following figure shows the reflective properties of the UV
enhanced aluminum coating (Gecko UV) shown along with the regular Al
coating, between 3000 and 5000Å. The UV coating gives a few
percent more reflectivity below 4500Å than a regular Al
coating. The reflectivity is still good up to and beyond 5000Å
(above 85%).
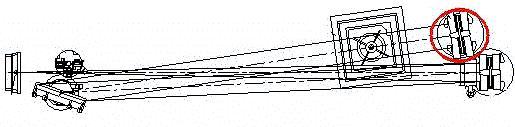
The beam from the camera mirror is reflected vertically downward by a
prism-lens towards the detector environment. The detector position and
orientation can be controlled about all three axes during alignment of
the spectrograph and to fine-tune wavelength settings during
observations. There are two corrector lenses, one for UV use
(3000-4500Å) and the other for blue-red use
(4000-10,000Å). The camera has an effective focal length of 1250mm
which results in a slit-to-detector demagnification of 0.208
perpendicular to the direction of dispersion, and 0.170 parallel to the
dispersion direction at the center of any order. One arcsecond on the
sky corresponds to 342 µm on the slit and 71 µm
perpendicular to the dispersion at the detector focal plane.

Adjustments are available for the observer to focus the spectrograph
(movement along the Z-axis) and to position the spectrum on the detector
by moving it along either the Y-axis (perpendicular to the direction of
dispersion) or the X-axis (parallel to dispersion) under computer
control. Rotational adjustments may also be made about any of these
three axes to align the spectra along rows or columns of the detector,
or, during instrument setup, to make the image and detector planes
parallel.
8. Detectors
Currently, 2 possibles CCDs may be installed on Gecko. EEV1 is used
for all wavelengths, although it shows fringing starting at about
6000Å (see the available
information on
fringing). If fringing is a problem,
MIT2 is offered on a
shared-risk basis, but its QE is not as good as EEV1's in the blue.
| Detector |
Format |
Pixel
Size
(µm) |
Thick
or
Thin |
Noise (e) |
QE @
3500Å |
QE @
5000Å |
QE @
6500Å |
QE @
9000Å |
| EEV1 | 2048 x 4500 | 13.5 |
Thin | 4.63 |
42% | 82% | 78% | 27% |
| MIT2 | 2048 x 4096 | 15 |
Thin | 7.5 |
<5% | 68% | 92% | 62% |
9. Exposure Meter
The spectrograph is equipped with a pulse-counting exposure
meter. The Exposure Meter is fed by reflection from one of up to three
pellicles/filters located behind the slicer. The "clear" pellicle is
used in most of the cases; the other options offered are filters used to
feed the E.M. and also to cut some extra-orders that overlap the order
of interest when using a grism in the red. It is important to select the
"clear" pellicle and not a filter if no extra orders are present.
A limited number of filters are available for use with the exposure
meter. Since guiding is best done by referring to the exposure meter
ratemeter, it is advisable to use a filter combination giving a system
response peak close to the observed wavelength. This is particularly
important in the blue and ultraviolet where atmospheric refraction is
large.
The pellicles and filters are selected according to the wavelengths
requested by the observers and installed during the instrument's
setup. The choice of E.M. pellicle and E.M. filter for a particular
wavelength is automatically made when a wavelength is setup using the
"gs" script.
The Exposure Meter is switched ON at the beginning of the night and
OFF at the end of the night by the Observing Assistant. Once again, to
prevent damage to the photomultiplier tube, be sure to close the
E.M. shutter before using any lights around the slit area or in the
Coudé room. There are software interlocks in the control computer
to close the exposure meter shutter prior to turning on either the
flat field lamp or the comparison lamps, but there is no interlock with
the room lights or protection against use of flashlights around the
exposure meter.
In the Control Room, there is an ORTEC crate with a Ratemeter,
Counter and Power unit. First, power ON the crate. Then, on the Counter,
set the counter function to count and hit "Reset" to initialize. On the
Ratemeter, adjust the range and audio level to suit your
requirements. The time constant should be set to 0.3 for bright stars
and 1 to 3s for faint objects. The "Gain" on the Amp/Disc module should
be 20. |
 |
10. Comparison and Flat Field
Lamps
CAFE
| The CAFE head mounted on the Cassegrain Bonnette contains
a flat field Halogen lamp with 7 intensities and a Th/Ar hollow cathode
source. For each of these lamps, a small, precisely aligned mirror (in
the Central Opto-Mechanical Sub-Assembly) is positioned so that the
light gets into the fiber optic, and then to the Bowen-Wallraven slicer.
Lamps are selected via the "Gecko Configuration" form of the
observing session. A lamp may be left in an automatic mode (AUTO), in
which the proper mirror is rotated in place and the lamp is turned on
and off automatically when the "comparison" type or "flat" is selected
in the "Expose" window. However, for certain tests it is possible to
select ON, which leaves the lamp always ON.
The
CFHT Coudé Comparison Arc Spectral Atlases
is available on-line. |
 |
11. Performance and Throughput
Estimates
The following table gives some Gecko sensitivity estimates, based on
old data taken with the LORAL3 thick CCD and ORBIT1 thin CCDs, as well
as with the Loral5 thick and EEV2 thin CCDs. Counts are given in terms
of electrons/sec/column (i.e. the spectral data have been integrated
perpendicular to the dispersion) for a V = B-V = U-B = 0 star. Note that
throughputs at a given wavelength are sometimes given for two different
orders, and with various filter or grism combinations. A
more recent
set of measurements is also available.
| Wavelength |
Order |
Loral3 |
Orbit1 |
Loral5 |
EEV2 |
| (Å) | |
e/s/col | Order sorting |
e/s/col | Order sorting |
e/s/col | Order sorting |
e/s/col | Order sorting |
| 3130 | 18 |
360 | UV Grism | 2250 | UV Grism |
| | | |
| 3983 | 14 |
| | 33200 | UV Grism |
| | | |
| 4032 | 14 |
| | 32800 | UV Grism |
| | | |
| 4047 | 14 |
6000 | Blue Grism | | |
| | | |
| 4055 | 14 |
| | 39000 | UV Grism |
| | | |
| 4512 | 12 |
| | 43400 | Blue Grism |
| | | |
| 5170 | 11 |
42000 | #1508 | | |
| | | |
| 5786 | 10 |
| | | |
41800 | #1519 | | |
| 5885 | 9 |
| | 122100 | Blue Grism |
| | | |
| 5890 | 9 |
34400 | #1519 | | |
| | | |
| 5894 | 9 |
| | | |
83160 | #1519 | | |
| 5957 | 9 |
| | | |
91600 | #1519 | | |
| 6150 | 9 |
53000 | #1508 | | |
| | | |
| 6150 | 9 |
52000 | Red Grism | | |
| | | |
| 6150 | 9 |
43000 | Blue Grism | | |
| | | |
| 6150 | 9 |
40800 | #1519 | | |
| | | |
| 6377 | 9 |
| | | |
| | 28900 | #1604 |
| 6428 | 9 |
22400 | #1617 | | |
| | | |
| 6613 | 8 |
| | | |
74200 | #1621 | | |
| 6707 | 8 |
69000 | #1626 | | |
| | | |
| 6985 | 8 |
| | | |
| | 35885 | Red Grism |
| 7740 | 7 |
| | | |
| | 42848 | Red Grism |
| 7773 | 7 |
42000 | #1704 | | |
| | | |
| 8100 | 7 |
23160 | #1803 | | |
| | | |
| 8542 | 7 |
5100 | #1803 | | |
| | | |
| 8542 | 6 |
19800 | #1803 | | |
| | | |
| 9086 | 6 |
5100 | #1901 | | |
| | | |
|
Limited tests have shown that the spectrograph appears to have very
good scattering properties. Analysis of the spectra of several heavily
reddened early-type stars with saturated Na I D absorption lines
indicates that the percentage of scattered light in the spectrograph at
this wavelength, and with the blue grism as the order-sorting device, is
only about 1.4% if the interorder light is carefully subtracted from the
spectrum. The accompanying figure shows the residual intensity in the
core of one of the Na I D lines for one of these objects. |
 |
CAFE
Here is the theoretical comparison of CAFE's and the mirror train's
efficiency:
| |
4500Å |
5700Å |
8000Å |
| Coudé train throughput (from M3 to M7) |
73% | 83% | 82% |
| CAFE throughput (from CAFE to fiber output) |
79% | 84% | 84% |
| Overall throughputs (slicer and Gecko central obscuration
included) |
| | |
| Coudé train overall throughput |
45% |
51% |
50% |
| CAFE overall throughput |
51% |
55% |
53% |
 Back to Gecko's Web Manual
http://www.cfht.hawaii.edu/Instruments/Spectroscopy/Gecko/Manual/Spectro.html
Send comments to: manset -=AT=- cfht.hawaii.edu
Copyright © 2004. CFHT Corporation. All rights reserved.
 Web Manual for Gecko - The f/4 Spectrograph