|
The following diagrams are built using image quality measurements from all
data collected through the first two semesters of QSO operation (10B+11A) for CFHQSIR.
Only the validated exposures (all 75 seconds long) were considered. Note that the
exposure time is long enough to ensure that the natural seeing is well integrated.
The image quality per image (metric: FWHM isophotal) is an average over the four
detectors of the mosaic.

Description :
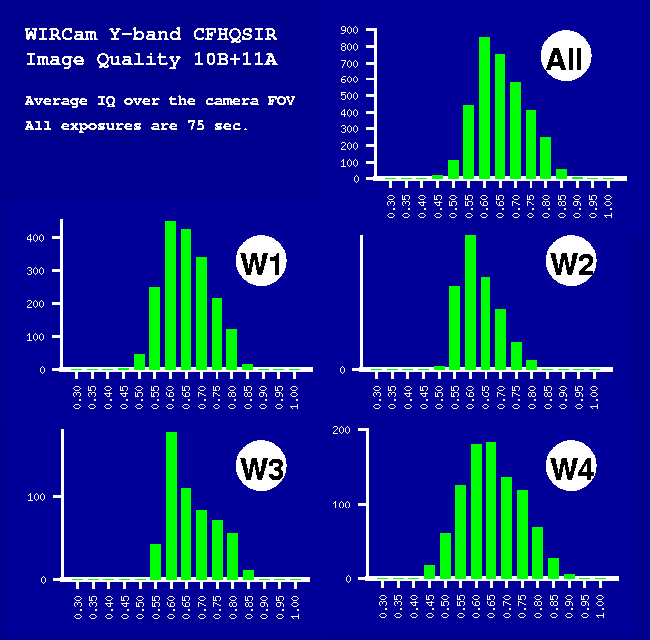
For the entire CFHQSIR and each of the four Wide patches, the histogram gives the
number of images obtained in the given image quality bracket. Each bar is 0.05 arcsec. wide.
Discussion :
The mode of the histogram is the same for all five data set: 0.60". No seasonal signature
is apparent, e.g. winter field (W2) vs summer field (W4). Because the QSO image quality
constraint is 0.80" for this observing program, the histograms are by design truncated at
that bracket. Since the CFHQSIR program uses a large chunk of telescope time, these plots
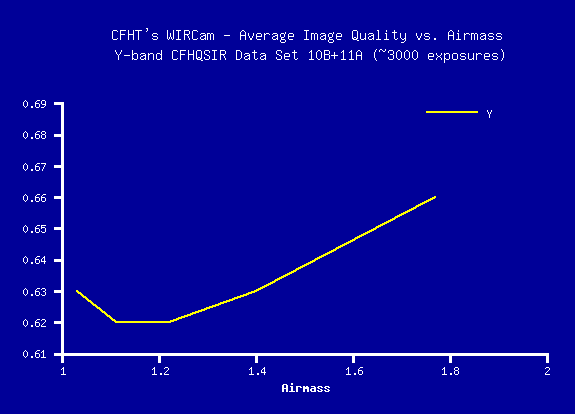
indicate that the median image quality at CFHT in the Y-band is 0.62" (see Global Statistics section) at
a median airmass of 1.2: this is comparable to the MegaCam z' value of 0.64" (Cuillandre & Racine 2011).
|


